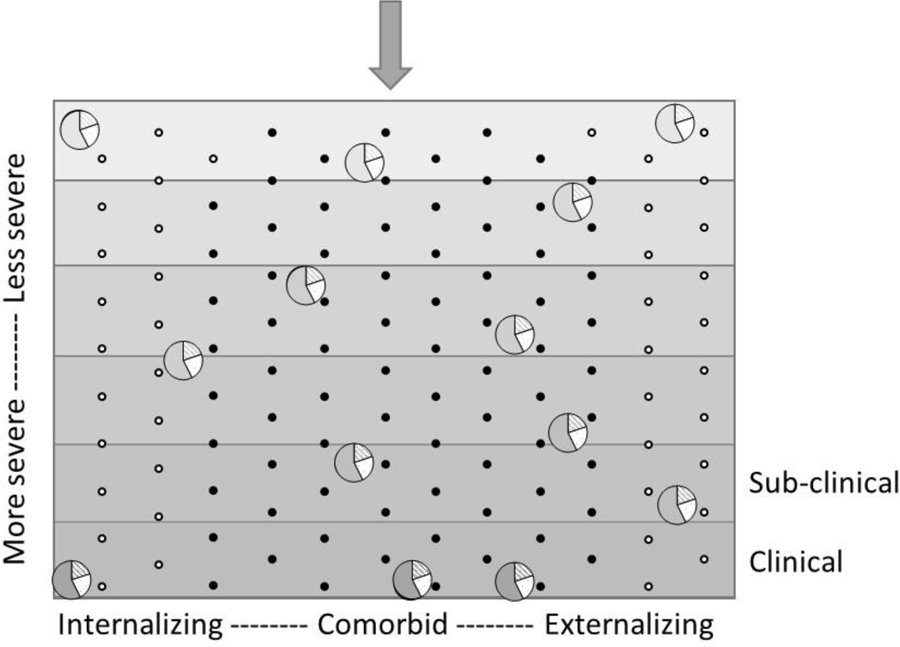
Figure 3. Results depicted in the context of the Plinko board representing the severity-directionality model.

Circles represent individuals. The y-axis represents symptom severity, with gravity pulling balls downward to more severe symptomatology. The shaded gradations of the background correspond to the density of the liquid filling that part of the plinko board. The shade of the circle also represents density, which is key for determining the penetrance into symptom severity. Here, the pie-chart pieces of the circle depicts the percentage of variance each influence exerts on that ‘density’ – solid color indicates genetic influence (58%), diagonal lines indicate shared environmental influence (20%), and white background dots indicate nonshared environmental influence (23%). The x-axis represents symptom directionality. The dots (e.g., the pegs) represent various ‘specialist’ influences that push individuals towards internalizing or externalizing or comorbid problems, regardless of how deep into the board they sink. Black dots represent specialist genetic influences (65%), whereas white dots represent the hypothesized ‘specialist environments’ that are nonshared environmental in nature (35%).
