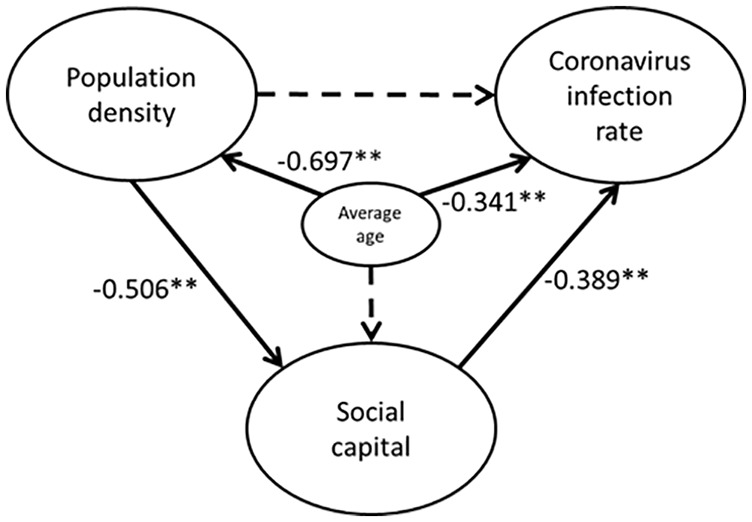
Figure 5.

Result of path analysis (Controlled by average age).
Note. **Significant at 1% level.
*Significant at 5% level. n = 47.
Dashed arrow indicates not significant at 5% level.
Goodness-of-fit indices: χ2 = 2.150; df = 2; root mean square error of approximation (RMSEA) = 0.000; probability of close fit (PCLOSE) = 0.533; goodness of fit index (GFI) = 0.985; adjusted goodness of fit index (AGFI) = 0.926; normed fit index (NFI) = 0.979; comparative fit index (CFI) = 1.000.
