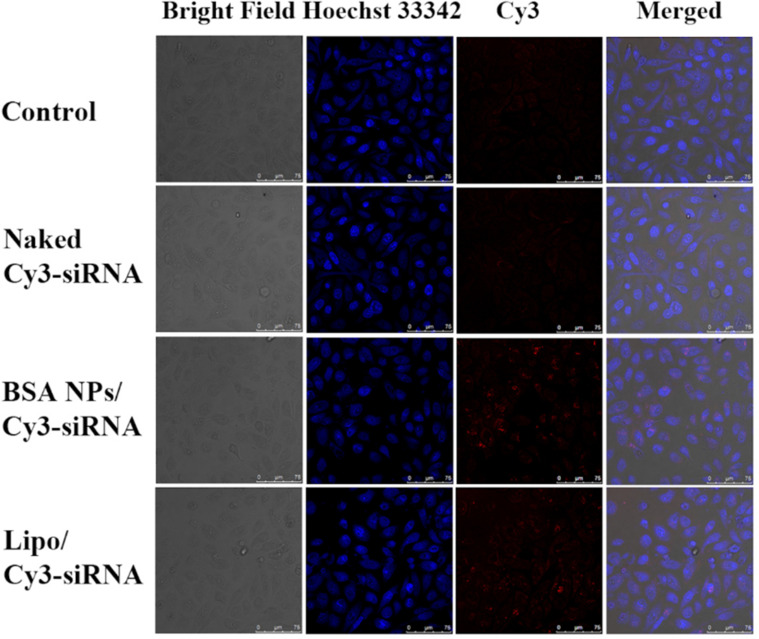
Figure 6.
Cellular uptake of BSA NPs/siRNA in MCF-7 cells. The cells were treated with PBS (Control), Naked Cy3-siRNA, BSA NPs/Cy3-siRNA and Lipo/Cy3-siRNA for 4h, respectively, and the fluorescence signals were recorded by confocal laser scanning microscopy (CLSM). The blue fluorescence represented cell nucleus dyed by Hoechst 33342. The bright red fluorescence represented the location of Cy3-labelled siRNA.

