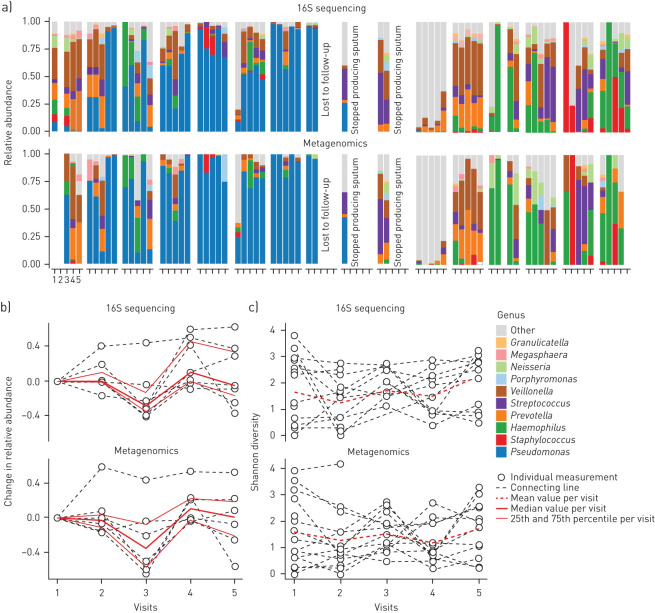
FIGURE 1.
Change in the lung microbiome during lumacaftor/ivacaftor treatment. a) Composition of the lung microbiome measured in sputum by 16S rRNA and metagenomics sequencing. The x-axis indicates the visits, with visit 1 before start of treatment and subsequent visits 3 months apart. The y-axis indicates relative abundance. The upper panel shows results from 16S sequencing and the lower panel from metagenomics analysis. Fill colours correspond to the genus level annotation. b) Cumulative relative abundance of Pseudomonas aeruginosa based on ASVs/metagenomes matched to this particular species. Only patients with a non-zero Pseudomonas aeruginosa count at baseline are included in the graph. The x-axis indicates the visits, with visit 1 before start of treatment and subsequent visits 3 months apart. The y-axis indicates absolute change in relative abundance. The red line indicates the median value per visit with the thinner lines indicating the quantile intervals. The upper panel shows results from 16S sequencing and the lower panel from metagenomics analysis. c) Shannon diversity. The x-axis indicates the visits, with visit 1 before start of treatment and subsequent visits 3 months apart. The y-axis indicates Shannon diversity. The red line indicates the mean value per visit. The upper panel shows results from 16S sequencing and the lower panel from metagenomics analysis.

