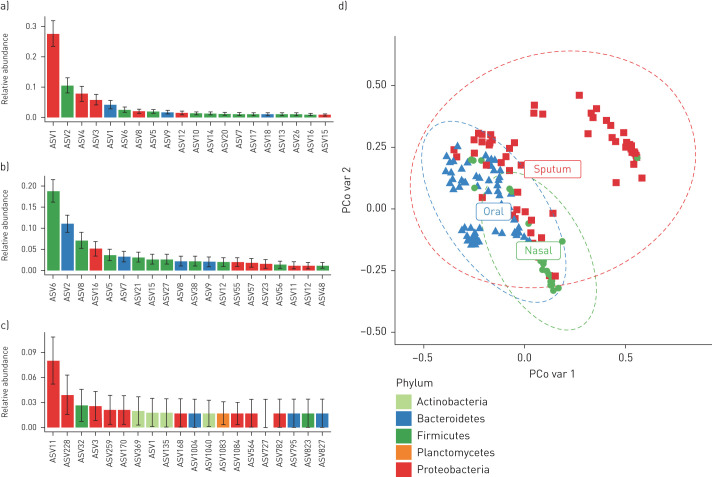
FIGURE 2.
Most abundant amplicon sequence variants (ASVs) in sputum, nasal wash and oral wash. The mean relative abundance of the top 20 most prominent ASVs found in a) sputum, b) oral wash and c) nasal wash of the included patients. The bar indicates the mean relative abundance while the error bar gives the standard deviation of the mean. d) Microbial composition between sample materials, with the x-axis indicating principal coordinate 1 (PCo var 1) and the y-axis principal coordinate 2 (PCo var 2) on the Bray–Curtis dissimilarity measure of 16S microbiome data. The sputum samples are distinct from the oral and nasal samples (p<0.0001).

