FIGURE 3.
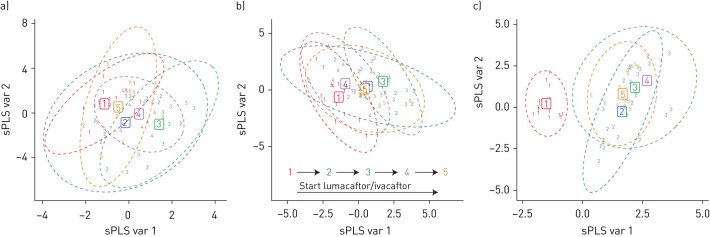
Change in metabolic composition of sputum and breath during lumacaftor/ivacaftor treatment. The x-axis is the sPLS projected variable 1 (sPLS var 1, containing 9, 9 and 23% of variation) and the y-axis sPLS projected variable 2 (sPLS var 2, containing 12, 6 and 8% of variation). a and b) Change in metabolic composition of sputum after the start of lumacaftor/ivacaftor treatment. There is a significant change from visit 1 (before start of treatment) to visit 3 (6 months after treatment; p=0.0015 for dataset 1 and p=0.004 for dataset 2) with tendency to return to baseline after 12 months (p=0.031 for dataset 1 and p=0.014 for dataset 2). a) Data obtained by GC-TOF-MS (n=69). b) Data obtained by HILIC-TOF-MS (n=79). c) Change in metabolomic composition of exhaled breath (n=68) after the start of lumacaftor/ivacaftor. After start of treatment there is a significant difference in metabolic composition (p<0.0001) that does not return to baseline at the end of the observation period (p=0.0002).

