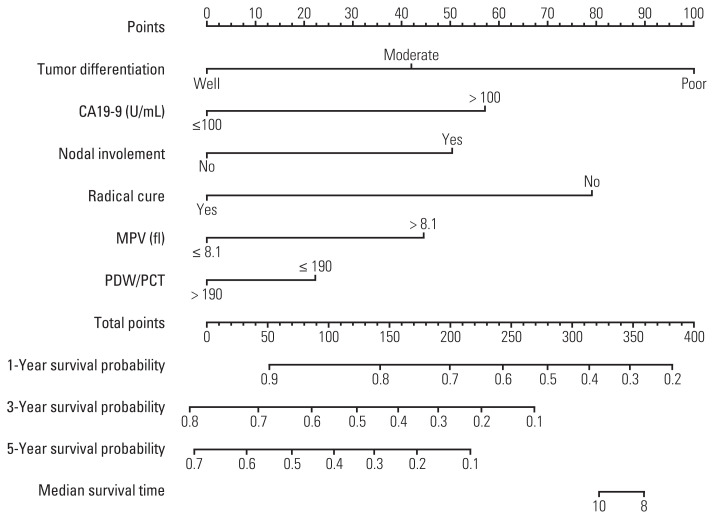
Fig. 2.
Nomogram for predicting the 1-, 3-, 5-year, and median survival in patients with biliary tract cancer lines are drawn upward to determine the points for each variable. Total points represent the sum of points corresponding to each variable. Another line is drawn downward to determine the survival probability for total points. CA19-9, carbohydrate antigen 19-9; MPV, mean platelet volume; PCT, plateletocrit; PDW, platelet distribution width.

