Fig. 5.
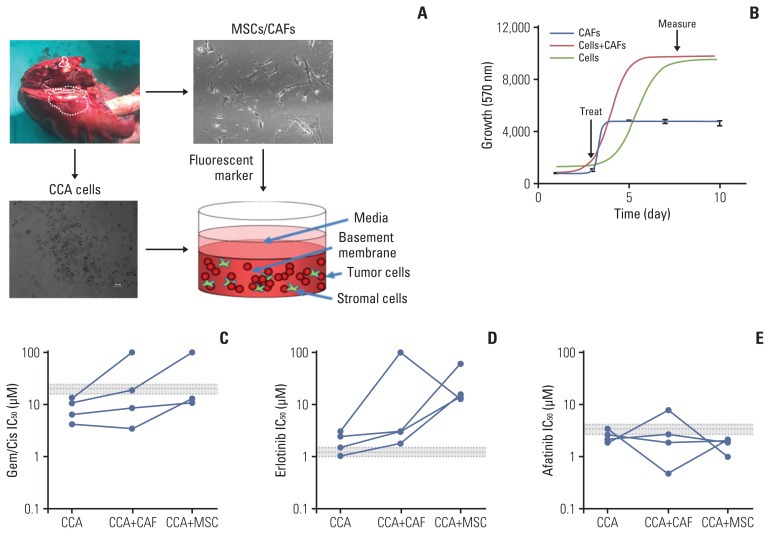
Effect of ErbB inhibitors on primary cholangiocarcinoma (CCA) lines in 3D-tumor growth assay (TGA). (A) Four primary cells were derived from surgically resected CCA tissue samples; CCA-UK5, CCA-UK6, CCA-UK7, and CCA-UK9. Primary cells (dashed), matched cancer associated fibroblasts (CAFs) also derived from the same tissue samples (solid), a human mesenchymal cell line (mesenchymal stem cell [MSC] not shown) or a mixture (CAF+cancer cells shown as dotted line) were employed for the 3D-TGA. (B) Growth of cells, CAFs, and primary cells and CAF (red line) or MSC (green line) mixed with the primary cells was measured using AlamarBlue. Percent cell survival of CCA1 and CCA2 treated with gemcitabine/cisplatin (Gem/Cis) (C), erlotinib (D), or afatinib (E). The mean±20% peak serum concentration for patients is given as the dotted and shaded lines (grey).

