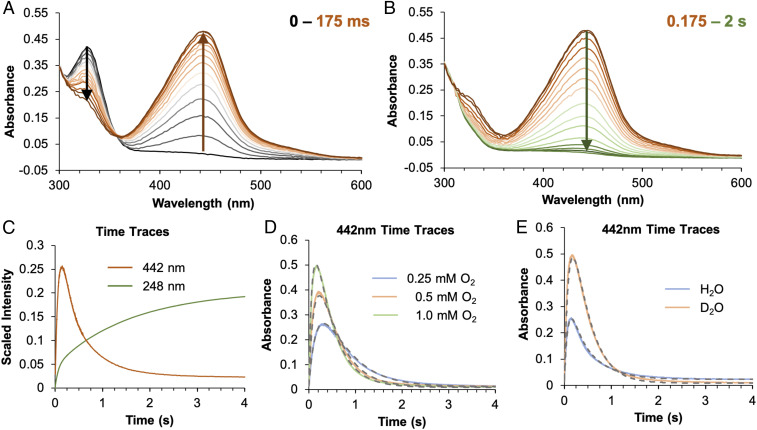
Fig. 2.
Stopped-flow absorption spectra monitoring the reaction of 0.15 mM (FeII/BH4/Trp)-TPH with 1 mM O2 in Hepes/(NH4)2SO4/sucrose buffer (pD 7) showing (A) the disappearance of an absorption at 330 nm (black arrow) and the growth of an absorption feature at 442 nm (brown arrow) in the first 175 ms and (B) its subsequent decay (green arrow) within 2 s. (C) Monitoring the reaction of 0.125 mM (FeII/BH4/Trp)-TPH in Hepes/(NH4)2SO4 (pH 7) with 1 mM O2 at 442 nm (orange, with sucrose added) and 248 nm (green, without added sucrose). (D) Monitoring the reaction of 0.15 mM (FeII/BH4/Trp)-TPH in Hepes/(NH4)2SO4/sucrose buffer (pD 7) with 0.25 mM O2 (blue), 0.5 mM O2 (orange), and 1 mM O2 (green) at 442 nm. These time traces were fitted (gray dashes) with the kinetic model presented in Scheme 2. (E) Monitoring the reaction of (FeII/BH4/Trp)-TPH with 1 mM O2 in Hepes/(NH4)2SO4/sucrose buffer at pH 7 (blue, 0.125 mM protein) and pD 7 (orange, 0.15 mM protein) at 442 nm. These time traces are fitted with the kinetic model presented in Scheme 2, and enlarged fits of both the H2O and D2O O2-dependent data are shown in SI Appendix, Fig. S13.

