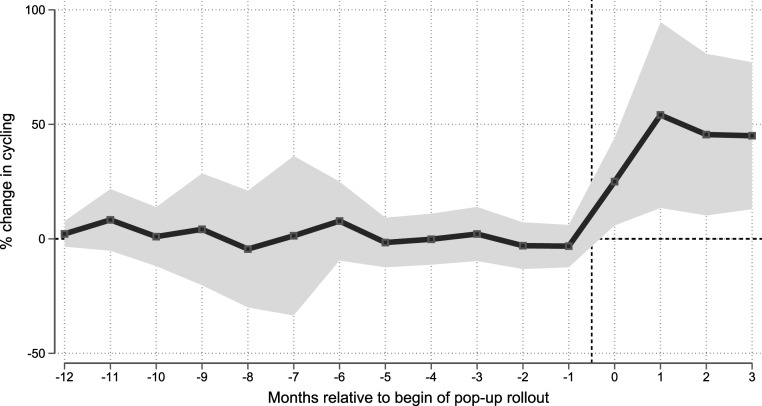
Fig. 2.
Treatment effect (difference between treated and control cities) in months before and after the beginning of the pop-up bike lane policy. Observations are binned into months. Treatment for this plot is hard coded to March 2020 and the baseline category and the beginning of the sample are set to February 2019. Estimates are from Poisson regressions that include city and country–day fixed effects (SI Appendix, Eq. S1). The shaded area shows the 95% confidence interval. Data for the outcome variable are from the European Cyclists’ Federation (3) and data for the treatment variable are from municipal bike counters (Materials and Methods).

