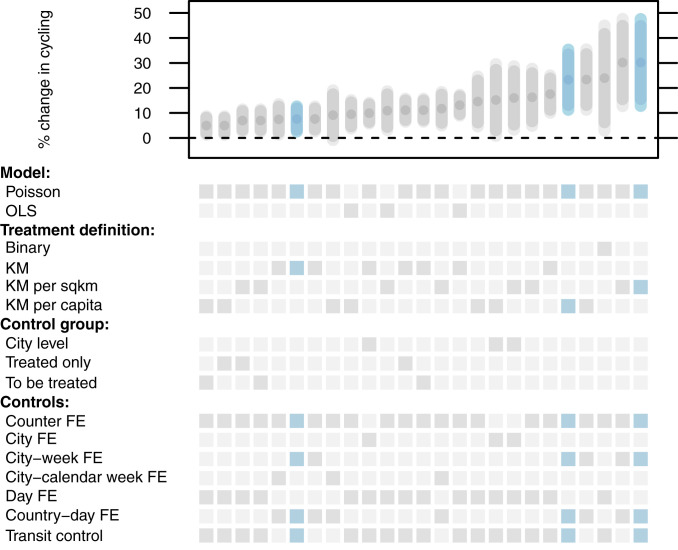
Fig. 3.
Estimates of the average effect of pop-up bike lanes on cycling. Dose–response regressions (in kilometers, kilometers per capita, or kilometers per square kilometer in service on a given day) are multiplied by the average treatment dose. The 90 and 95% confidence intervals are shown in darker and lighter color. The unit of observation is the bike counter except for regressions at the city level. Preferred specifications are marked in blue (Eq. 1) and are reported in more detail in SI Appendix, Table S5. Gray (and blue) indicators (Bottom) indicate the type of specification. Three estimates are from OLS specifications and therefore use the natural logarithm of the bicycle count as the outcome. All other specifications are Poisson regressions using the level of the count. Data for the outcome are from the European Cyclists’ Federation (3) and data for the treatment are from municipal bike counters (Materials and Methods). All regressions include controls for the number of active counters in a city on a given day and for the weather (temperature, sunshine, wind, precipitation) (7). All regressions, except those that rely on observations before 2020, include a control for overall mobility (8). The transit control is from Apple routing requests (2020 only) (1). Code is from ref. 9.

