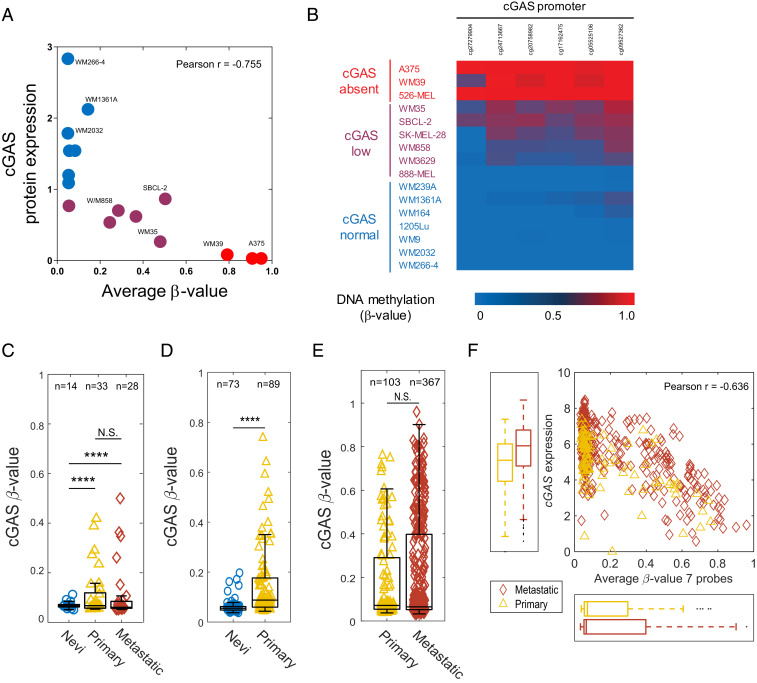
Fig. 2.
Promoter hypermethylation of cGAS is strongly associated with its silencing in human melanoma. Correlative analysis between cGAS promoter methylation (average β-values for six probes) and its protein expression in 16 human melanoma cell lines. Cells are colored based on their cGAS protein expression (red: no expression, purple: low expression, and blue: normal expression) (A). β-value heat map showing DNA methylation levels for six cGAS probes identifies three distinct sample subclasses based on their cGAS protein expression (cGASabsent, cGASlow, and cGASnormal) among melanoma cell lines (B). Box plots showing the average β-values (seven probes) for cGAS across nevi, primary, and metastatic melanoma samples in GSE86355 (C), GSE12087 (D), and TCGA datasets (E). Box plot represents the lower, median, and upper quartile, while whiskers represent the highest and lowest range for the upper and lower quartiles. Each data point represents an individual sample. Numbers above boxplots indicate number of samples in each group. The statistical analysis was performed by Bartlett’s test (****P < 0.0001; N.S., not significant) (C–E). (F) Correlative analysis between cGAS gene expression and promoter methylation (average β-values for seven probes) in primary (n = 102) and metastatic (n = 367) melanoma samples (F).

