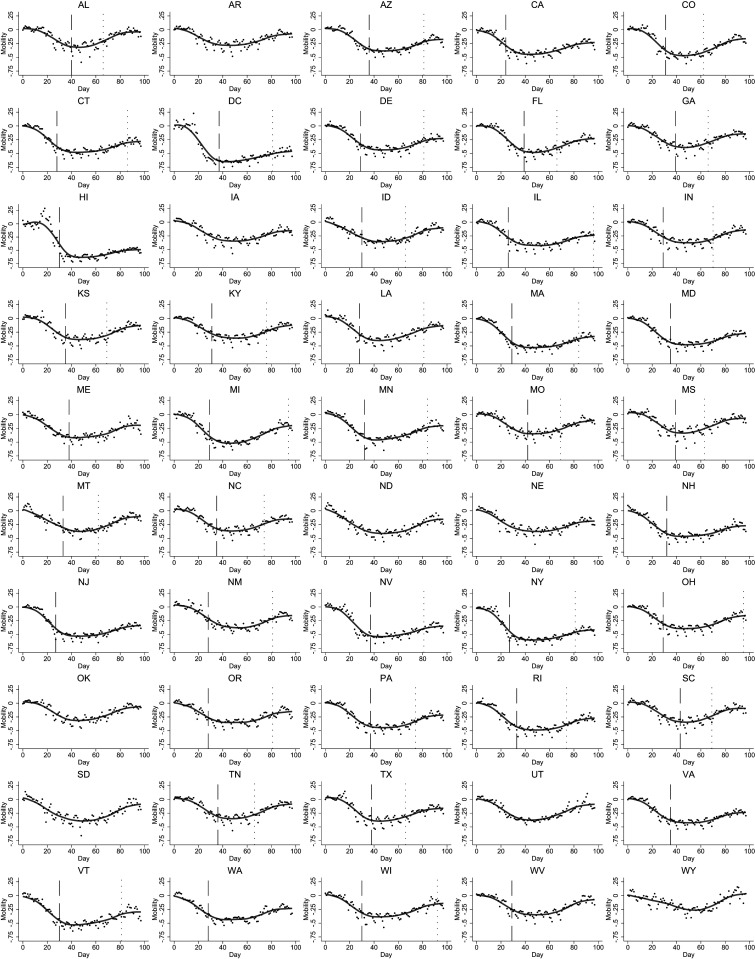
Fig. 1.
Mobility by state over time. Day indicates days after February 24. Mobility is the proportional change relative to the beginning of the time series. The dashed lines indicate the start of a state SIP policy, and the dotted lines indicate the end. There are clear nationwide trends, and mobility was already declining in most states before a SIP policy.

