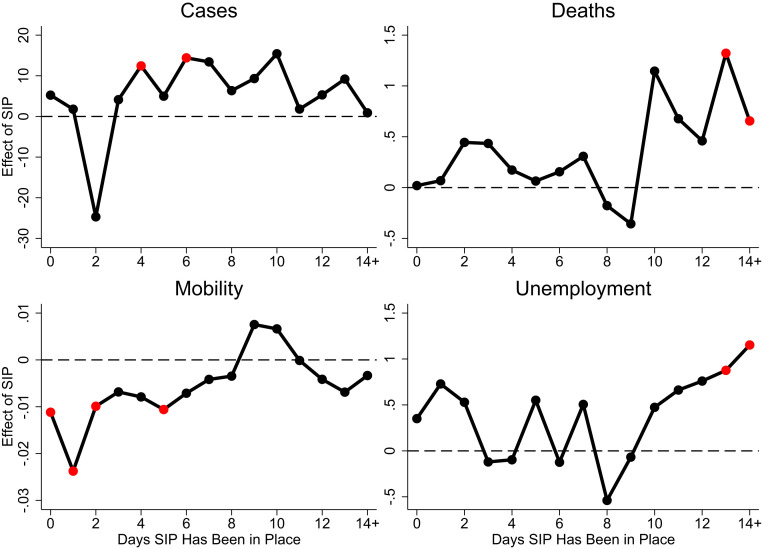
Fig. 2.
Effects of SIP policies over time. The figure shows the estimated effects of having a SIP policy in place for 0 d to 14+ d in a row. Estimates that are statistically distinguishable from zero (P < 0.05) are red. We regressed the outcome of interest on state fixed effects, day fixed effects, lags of the dependent variable, our SIP policy variable, and 14 lags of the SIP policy variable. To estimate the effect of 2 d of SIP policies, for example, we add the coefficients associated with the SIP policy variable, the 1-d lag, and the 2-d lag, and we conduct an F test of the null hypothesis that this sum is equal to zero. Complete results for these regressions are shown in column 7 of SI Appendix, Tables S1–S4.

