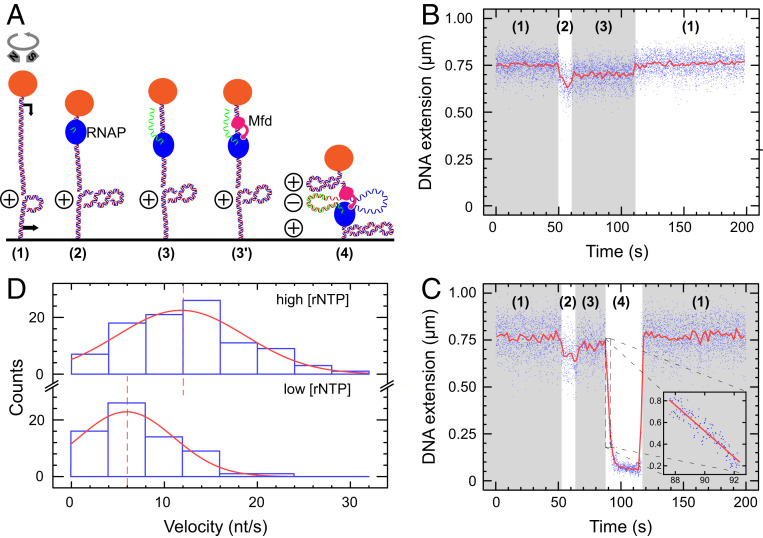
Fig. 1.
Mfd interacts with elongating RNAP to form a tripartite supercoiled domain. (A) Experimental model. The 4.6 kbp DNA bears a promoter (black arrow, top) and terminator (black arrow, bottom) separated by ∼900 bp of DNA and is tethered between a magnetically trapped bead (orange) and a glass surface. DNA is positively supercoiled prior to addition of components (RNAP: blue, Mfd: pink). During synthesis of RNA (green), Mfd can bind to elongating RNAP and DNA to form a tripartite supercoiled domain. (B) RNAP-only time trace showing phase (1) positively supercoiled DNA. In phase (2), as RNAP initiates it scrunches (16) and unwinds ∼2 turns of DNA, reducing DNA extension by ∼100 nm. In phase (3), successful conversion to an elongation complex results in an unwound bubble of ∼9 bp, and so DNA extension is reduced by only ∼50 nm compared with baseline. Upon transcription termination DNA returns to the phase (1) baseline state. (C) RNAP and Mfd time-trace showing phase (1) positively supercoiled DNA. Transcription initiation in phase (2) and conversion to the elongation state in phase (3) begins as in B, but then in phase (4) Mfd binds to RNAP and DNA to form the tripartite supercoiled domain. Here, ongoing elongation by RNAP causes a gain of positive supercoiling in the external domains, pulling the bead down toward the surface. Finally, loss of Mfd–RNAP interaction or RNAP termination causes the tripartite domain to reunite and dissolve, returning the DNA to the phase (1) baseline state. Blue points are the raw data (30 Hz); and the red line is the averaged data (1 s filtering). Inset focuses on the period of rapid bead descent at the beginning of phase (4) with linear fit (red line) used to measure bead velocity. (D) Bead descent rates in nm/s (see inset in prior panel) are converted to differential velocities of motor proteins (in bp/s) using the DNA supercoiling response (20, 25) and represented as histograms (blue) fit to Gaussian distributions (red). (Top) At high NTP concentration ([UTP] = [GTP] = [CTP] = [ATP] = 1 mM), we obtain a mean differential velocity of 12 ± 0.8 nt/s (SEM, n = 96 events). (Bottom) At lower NTP concentration ([UTP] = [GTP] = [CTP] = [ATP] = 50 µM), we obtain a mean differential velocity of 6 ± 1.0 nt/s (SEM, n = 67 events). Dashed lines indicate mean values.

