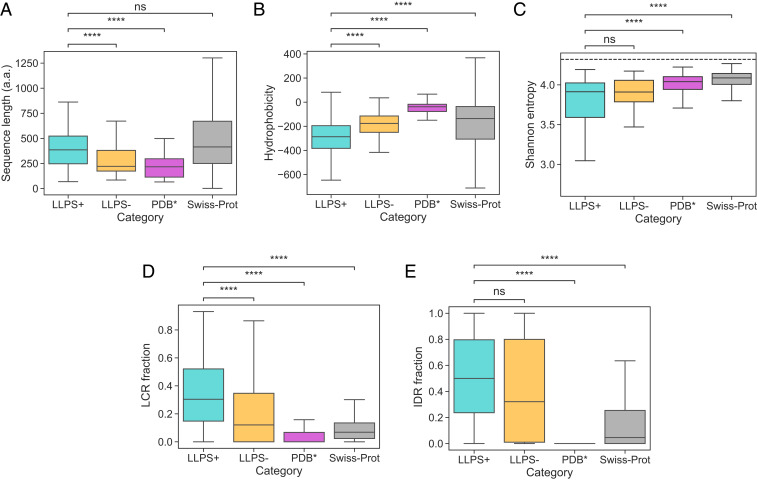
Fig. 2.
(A–E) Comparison of the (A) sequence length (in amino acids, a.a.), (B) hydrophobicity, (C) Shannon entropy, the fraction of sequence that is part of (D) the low-complexity regions (LCRs) and (E) the intrinsically disordered regions (IDRs) for the three training datasets and the Swiss-Prot. Comparative analysis highlighted that the average construct in the dataset (cyan) was longer than in the (orange) and the (magenta) datasets and less hydrophobic and had a higher LCR fraction than sequences in the , the , or the Swiss-Prot (gray) datasets. It also had a lower Shannon entropy and a higher IDR fraction than sequences in the or the Swiss-Prot datasets. The boxes bound data between the upper and the lower quartile, and the center lines indicates the mean value. The ends of the whiskers correspond to values that exceed the boundaries of the interquartile range by 1.5 times its size or to the most extreme value. Significance was tested with a Mann–Whitney test, **** denotes a P value below , and ns denotes no significance at . Full distributions are shown in SI Appendix, Fig. S1. The dashed line in C corresponds to the case when all amino acids are present at equal frequencies.

