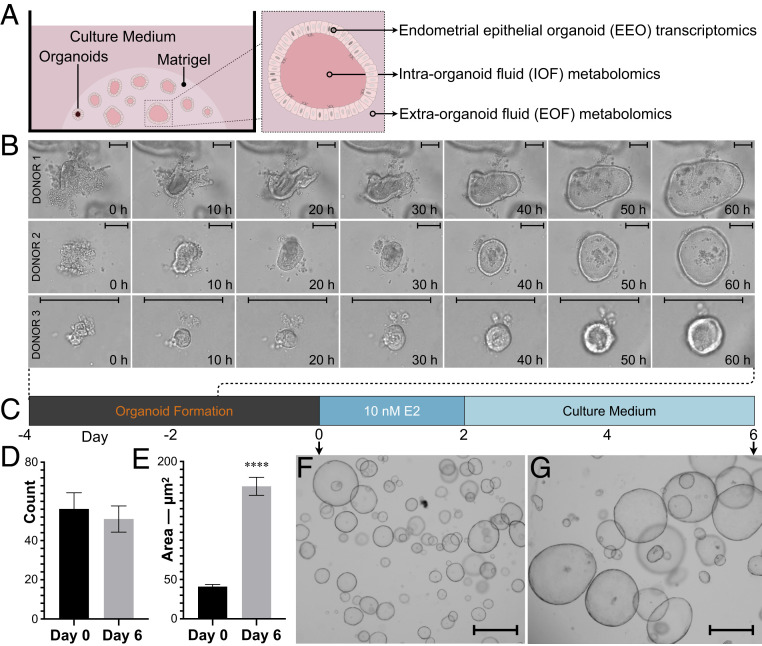
Fig. 1.
Study design and EEO monitoring. (A) Schematic depiction of study-dependent variables. (B) Time-lapse live imaging over 60 h of representative EEO formation from each donor. (Scale bars, 100 μm.) (C) Schematic depiction of the EEO preparation regimen including a 48-h 17β-estradiol (E2) exposure. Mean (±SEM) EEO (D) count and (E) areas on days 0 and 6 (n = 12); P ≤ 0.0001 (****). Representative EEO on days 0 (F) and 6 (G) at ×40 magnification. (Scale bars, 500 µm.)

