Fig. 4.
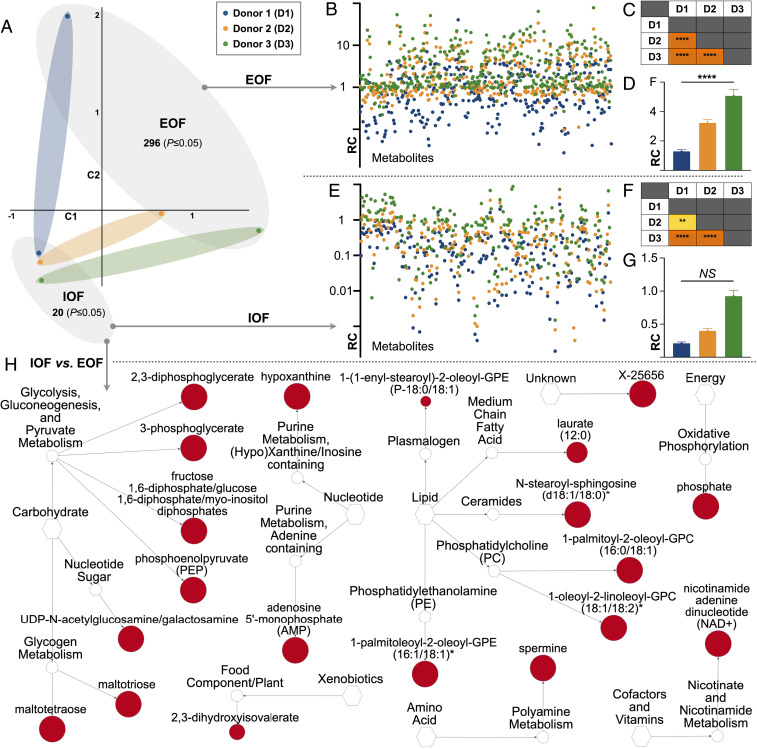
Quantitative intraorganoid fluid metabolomics. (A) Principal component analysis of IOF and EOF quantitative metabolic profiles from each donor in addition to the number of metabolites elevated (P ≤ 0.05) in each. (B) EOF metabolomic signatures by donor (relative concentration [RC]). (C) Corresponding EOF donor vs. donor statistical comparisons [P ≤ 0.0001 (****)] are also provided. (D) Mean total metabolite levels in EOF by donor. (E) IOF metabolomic signatures by donor. (F) Corresponding IOF donor vs. donor statistical comparisons [P ≤ 0.01 (**)] are also provided. (G) Mean total metabolite levels in IOF by donor (not significant [NS]). (H) Network view by pathway of the metabolites elevated (P ≤ 0.05) in IOF vs. EOF wherein node diameter is proportional to fold-change magnitude.

