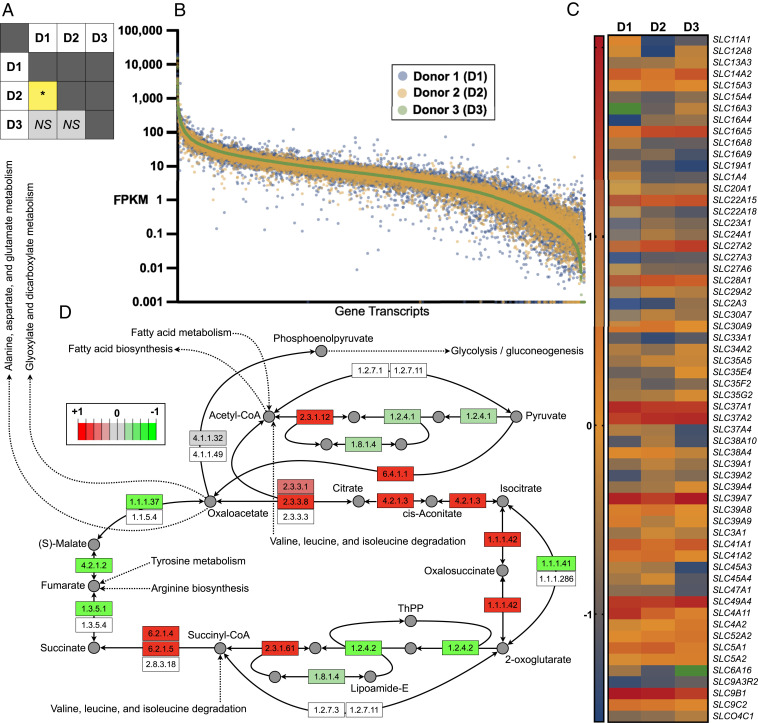
Fig. 5.
Tandem organoid transcriptomics. (A) Statistical comparison [P ≤ 0.05 (*); not significant (NS)] of transcriptomic profiles of endometrial epithelial organoids obtained from all three donors. (B) Logarithmically transformed FPKM values per donor per gene (transcriptomic signatures) presented in descending order. (C) Relative transcript abundance of SLC protein genes, specifically, those exhibiting a ≥2.0-fold change between two or more donors. Green depicts undetected transcripts. (D) Pathview and Kyoto Ecyclopedia of Genes and Genomes (KEGG) database adapted extrapolation and rendering of transcriptomic profiles of donors 1 vs. 2 within the context of the citric acid cycle, wherein green denotes enzyme transcript-relative down-regulation and red depicts enzyme transcript-relative up-regulation.

