Fig. 4.
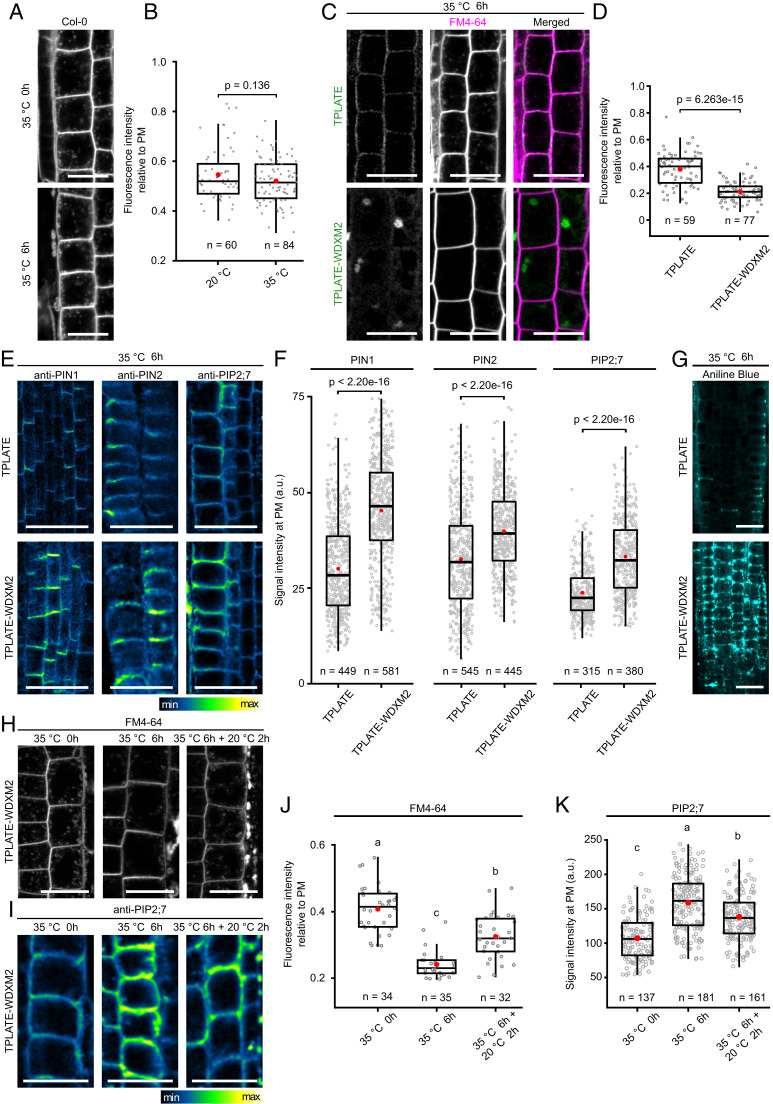
Destabilizing TPLATE-WDXM2 by short-term heat stress impairs endocytosis. (A and B) Representative confocal images (A) and quantification (B) of FM4-64 uptake in WT Col-0 seedlings before and after 6 h heat treatment. (Scale bars, 20 µm.) Numbers at the bottom represent the number of cells analyzed from nine individual roots for each temperature. (C and D) Representative confocal images (C) and quantification (D) of FM4-64 uptake in TPLATE- and TPLATE-WDXM2–complemented lines after 6-h heat treatment. (Scale bars, 25 µm.) Numbers at the bottom represent the number of cells analyzed from 10 roots for each transgenic line respectively. (E and F) Representative immunolocalizations (E) and quantification (F) of fluorescence intensity on the PM of endogenous PIN1, PIN2, and PIP2;7 proteins after 6 h heat treatment in roots from TPLATE- and TPLATE-WDXM2–complemented lines. (Scale bars, 25 µm.) Numbers of measured PM are indicated at the bottom. At least 18 transgenic plants for each protein were measured. (G) Confocal images of Aniline blue staining after 6-h heat treatment in roots from TPLATE- and TPLATE-WDXM2–complemented lines. (Scale bars, 25 µm.) (H and J) Representative confocal images (H) and quantification (J) of FM4-64 uptake in TPLATE-WDXM2–complemented seedlings before and after heat treatment as well as following a 2-h recovery period. (Scale bars, 20 µm.) Numbers at the bottom indicate measured cells from at least five seedlings. (I and K) Representative immunolocalization images (I) and quantification (K) of PM fluorescence intensity of endogenous PIP2;7 proteins before and after heat treatment as well as following a 2-h recovery period in roots from TPLATE-WDXM2–complemented lines. (Scale bar, 25 µm.) Numbers at the bottom indicate measured cells from at least nine seedlings. Red circles represent the mean in B, D, F, J, and K. The P values in B, D, and F were calculated by the Mann–Whitney U test. Letters in J and K represent significantly different groups (P < 0.001) evaluated by the Tukey multiple pairwise-comparisons test.

