Fig. 1.
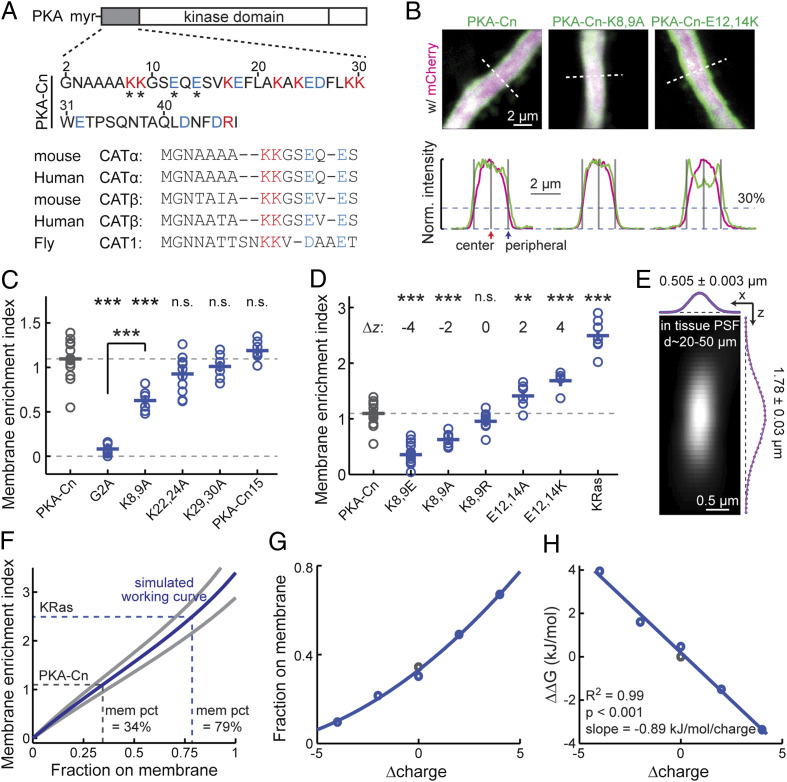
PKA-Cn is sufficient to localize a fraction of FPs to the plasma membrane. (A) Sequence of PKA-C N terminus showing balanced positive (magenta) and negative (blue) charges. (Upper) The 47 residues of mouse PKA-C used in this study. The residues affecting membrane affinity are indicated (asterisks). (Lower) Alignment of the first 15 residues of the indicated PKA-C subtypes and species. (B) Representative images and traces along the indicated dashed white lines of thick neuronal apical dendrites transfected with the indicated constructs for quantifying MEIs. The red fluorescence of mCherry is shown as magenta (to accommodate color-blind readers). Gray bars mark the locations where the fluorescence intensities are used to calculate MEIs: at the center and at the periphery where the red signal is at 30% of peak (corresponding to the plasma membrane) (16). (C) Collective MEI quantifications for the indicated PKA-Cn-mVenus constructs. From left to right, n = 16, 12, 6, 11, 7, and 7 for the indicated constructs. (D) Collective MEI quantifications for the indicated PKA-Cn-mVenus constructs and KRas-mEGFP. The charge relative to PKA-Cn (Δz) is indicated for each construct. The data for PKA-Cn is the same as in C. For other constructs, from left to right, n = 18, 6, 11, 6, 5, and 7. (E) Measured PSF in cultured hippocampal slices at imaging depths of 20 to 50 μm, n = 36. (F) MEI versus membrane-fraction working curves computed based on simulation using the measured PSF size and the experimental dendritic width of PKA-Cn at mean (blue) and one SD (gray). As indicated, the percentages of PKA-Cn and KRas on the membrane (mem pct) were estimated based on the mean-size curve. (G) Charge versus membrane-fraction relationships for the PKA-Cn constructs in D. Membrane fractions were estimated based on the mean MEI values and the corresponding dendrite sizes. (H) The relationship between the charge versus Gibbs free energy relative to wild-type PKA-Cn for the constructs in G and its linear fit. *P ≤ 0.05 and is statistically significant after Bonferroni correction for multiple tests, **P ≤ 0.01, and ***P ≤ 0.001.

