Fig. 2.
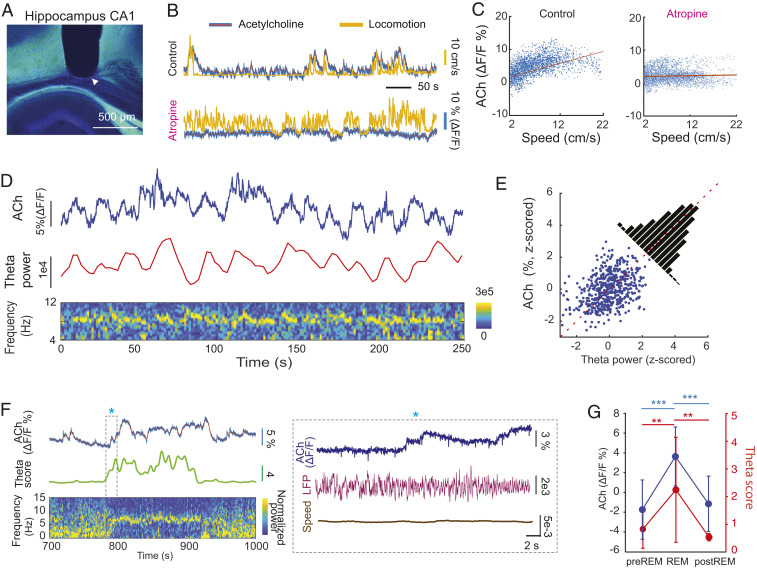
Behavior dependence of cholinergic activation in the hippocampus. (A) Track of optic fiber above the CA1 region of the hippocampus (tip is marked by white arrowhead). The ACh3.0 sensor was expressed in the hippocampal neurons by AAVs to allow detection of ACh dynamics in vivo. (B) An example ACh3.0 fluorescence signal, measured by fiber photometry, and movement recorded during spontaneous activity before (Top) and after intraperitoneal atropine injection (25 mg/kg; Bottom). (C, Left) The correlation between ACh3.0 fluorescence signal and speed of locomotion (Pearson correlation coefficient r = 0.64, P = 0). (C, Right) The correlation between ACh3.0 signal and speed of locomotion after atropine system injection (r = 0.06, P = 0). (D) The relationship between ACh3.0 signal and integrated theta oscillation power during spontaneous behavior. (D, Bottom) Time-resolved power spectrogram of hippocampal LFP. (E) The correlation between ACh3.0 fluorescence signal and theta power (r = 0.361, P = 4.55 × 10⁻¹⁸). (F) The relationship between ACh3.0 signal and theta oscillation score ( Materials and Methods) during REM sleep. The transition between non-REM and REM (asterisk) is shown at a higher time resolution in the Right. (G) ACh3.0 signal (Left y axis) increases during theta-rich REM sleep (theta score; Right y axis) compared to equal lengths of non-REM epochs before and after REM sleep. (n = 18 REM episodes in four mice; one-way ANOVA; theta score: P = 0.0007, ACh: P < 0.0001; Holm–Sadik’s multiple comparison test. Theta score: pre-REM (0.83 ± 0.69), REM (2.25 ± 1.90), and post-REM (0.54 ± 0.13), ACh3.0 fluorescent value: pre-REM (−1.73 ± 3%), REM (3.64 ± 3%), post-REM (1.15 ± 2.79%). **P < 0.01; ***P <0.001.

