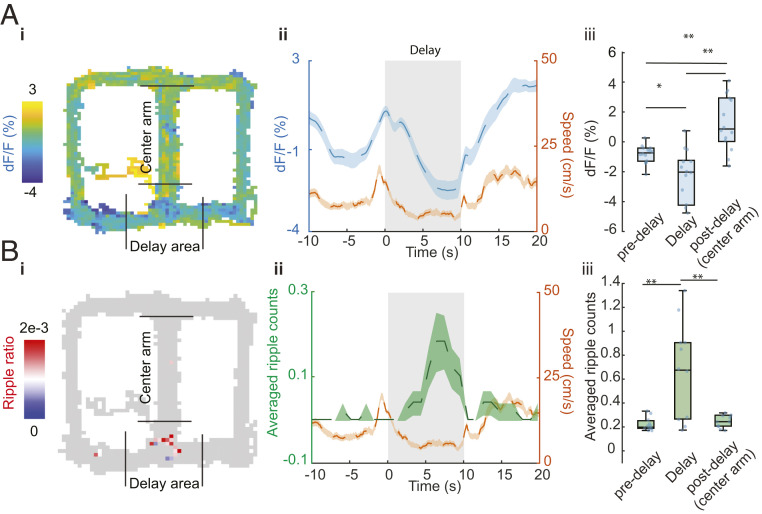
Fig. 4.
The relationship between ACh3.0 signal and SPW-Rs during spontaneous alternation behavior. (A) ACh3.0 fluorescence change during figure-eight–maze task. (i: ACh3.0 fluorescence signal on the maze, ii: Running in central and side arms and staying in the delay area show differential ACh signal modulation. n = 50 trials in an example session; mean ± SEM, iii: Group statistic of ACh3.0 signal for predelay area (−0.12 ± 0.64%), delay area (−2.42 ± 3.62%), and postdelay area (2.1 ± 1.9%). n = 14 sessions from four mice, P = 0.0006, one-way ANOVA, post hoc *P < 0.05; **P < 0.01; Holm–Sidak’s multiple comparison test. (B) SPW-Rs distribution during T-maze task. i: Example session of SPW-Rs distribution on the maze, ripple ratio: averaged ripple counts per bin (1 cm2). ii: Peri-delay area averaged ripple counts and locomotion results change during maze task. Speed signal is the same as in A. n = 50 trials. iii: Group statistics of average ripple counts in the predelay area (0.05 ± 0.06), delay area (0.56 ± 0.45), and postdelay area (0.10 ± 0.09). n = 11 sessions from 3 mice, P = 0.0022, one-way ANOVA, post hoc **P < 0.01; Holm–Sidak’s multiple comparison test.

