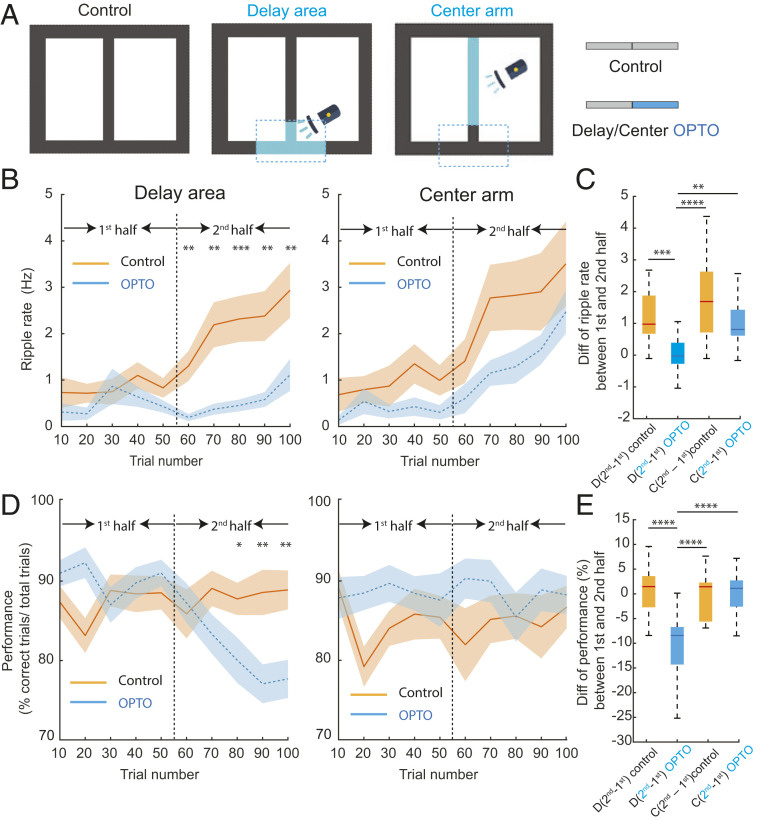
Fig. 5.
Cholinergic activation during delay area between choices suppresses SPW-Rs and impairs spatial working memory but not activation during center arm. (A) An illustration of task protocol (100 correct trials total). Control: no stimulation sessions, Delay sti: cholinergic stimulation (OPTO) during the last 50 trials in delay area (Blue) in delay sessions. Center sti: cholinergic stimulation during last 50 trials in the center arm (OPTO). (B) SPW-R rate (ripple rate) during the first half (1 to 50 correct trials) and second half (51 to 100 correct trials in no stimulation (Control) and optogenetic stimulation (OPTO) sessions in the delay area (Left ) or center arm (Right). Averages across all sessions (mean ± SEM). Note the steady increase in SPW-R rate during Control sessions and decreased SPW-R during OPTO stimulation in the delay area and continued increase in session with OPTO stimulation in the central arm. Control versus OPTO: Unpaired t test, *P < 0.05; **P < 0.01; ***P < 0.001. (C) Comparison of SPW-R rate difference between the first and second halves of trials in Control and OPTO stimulation sessions in the delay area (D) or central arm (C). One-way ANOVA: P < 0.0001, post hoc Holm–Sidak’s multiple comparison tests: *P < 0.05; **P < 0.01; ***P < 0.001, ****P < 0.0001. D(second − first)control = 1.39 ± 1.22 Hz, D(second − first)OPTO = −0.0009 ± 0.68 Hz, C(second − first)control = 1.74 ± 1.45 Hz, C(second − first)OPTO = 1.09 ± 0.85 Hz, mean ± SD. (D) Behavioral performance during the first half (1 to 50 correct trials) and second half (51 to 100 correct trials) in no stimulation (Control) and optogenetic stimulation (OPTO) sessions in the delay area (Left) or center arm (Right). Averages across all sessions and mice (mean ± SEM). Note the deterioration of memory performance during OPTO stimulation in the delay area. Control versus OPTO: Unpaired t test, *P < 0.05; **P < 0.01. (E) Comparison of behavioral performance difference between the first and second halves of trials in Control and OPTO stimulation sessions in the delay area (D) or central arm (C). One-way ANOVA: P < 0.0001, post hoc Holm–Sidak’s multiple comparison test: *P < 0.05; **P < 0.01; ***P < 0.001, ****P < 0.0001. D(second − first)control = 0.63 ± 5.23%, D(second − first)OPTO = −10 ± 6.91%, C(second − first)control = −0.10 ± 4.62%, C(second − first)OPTO = 0.16 ± 4.17%, mean ± SD.

