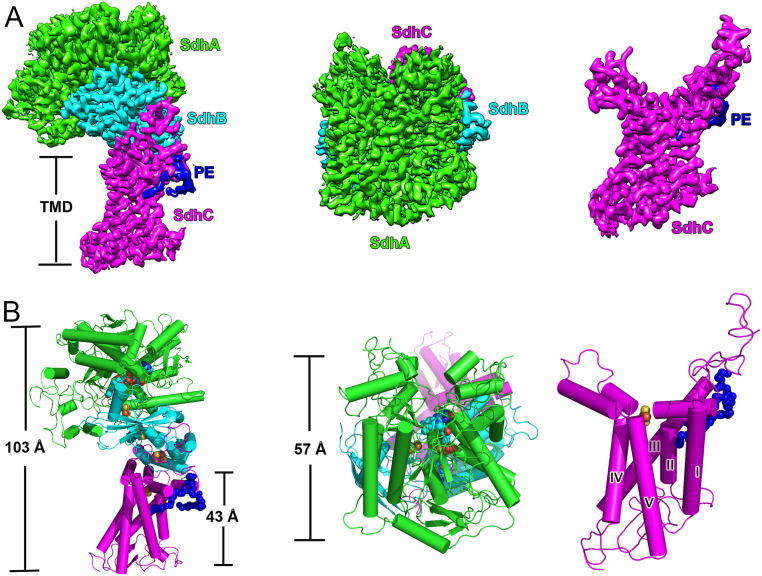
Fig. 1.
Overall structure of Msm succinate dehydrogenase 1. (A) Cryo-EM density map at 2.88-Å resolution. (Left) Front view; (Middle) top view (from cytoplasm); (Right) transmembrane region of Sdh1. SdhA, SdhB, and SdhC are colored in green, cyan, and magenta, respectively. PE is in blue. (B) Same views as a cartoon representation. The five transmembrane helices are labeled and PE is shown as blue spheres.

