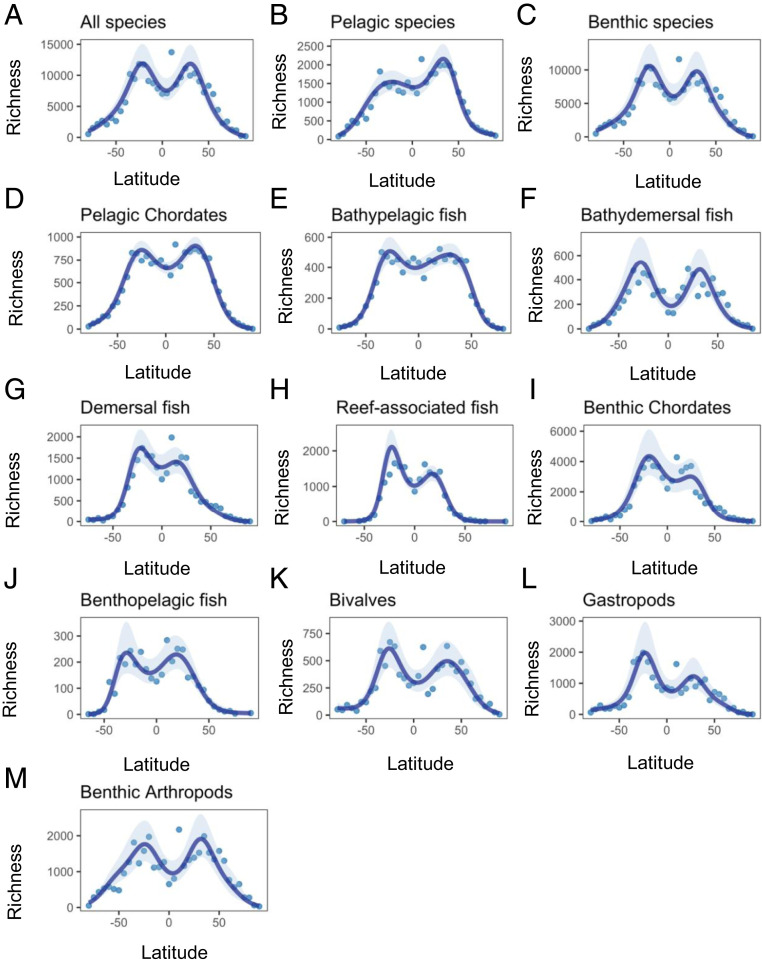
Fig. 1.
The latitudinal distribution of species richness in marine taxa at the scale of 5° latitudinal bands based on GAMs (the effect of latitude adjusting for shelf area) (SI Appendix, Table S2): (A) all species; (B) pelagic species; (C) benthic species; (D and E) organisms in the pelagic environment; and (F–M) organisms living near, on, or in the seabed. The shaded region in each graph shows the 95% confidence envelope for the fit.

