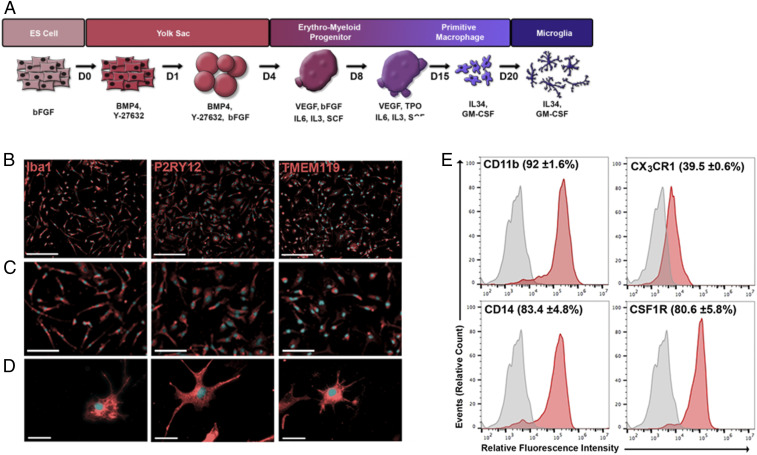
Fig. 1.
Differentiation of human iPSCs into microglia-like cells. (A) Schematic representation of the differentiation protocol showing media composition and culture conditions. (B) Immunocytochemical characterization of hiMG (red) and Hoechst nuclear staining (blue). (Scale bars, 200 µm.) (C) Higher magnification showing marker expression is evident in virtually every cell. (Scale bars, 100 µm.) (D) Even higher magnification images showing individual cell morphology and marker expression. (Scale bars, 25 µm.) (E) Flow cytometry analysis of cell-surface microglial markers. Representative histograms of CD11b-APC, CX3CR1-PE, CD14-APC, and CSF1R-APC; primary antibody (red) and unstained control (gray). Labels above each histogram indicate the mean percentage of positive cells and SEM (n = 3 biological replicates).

