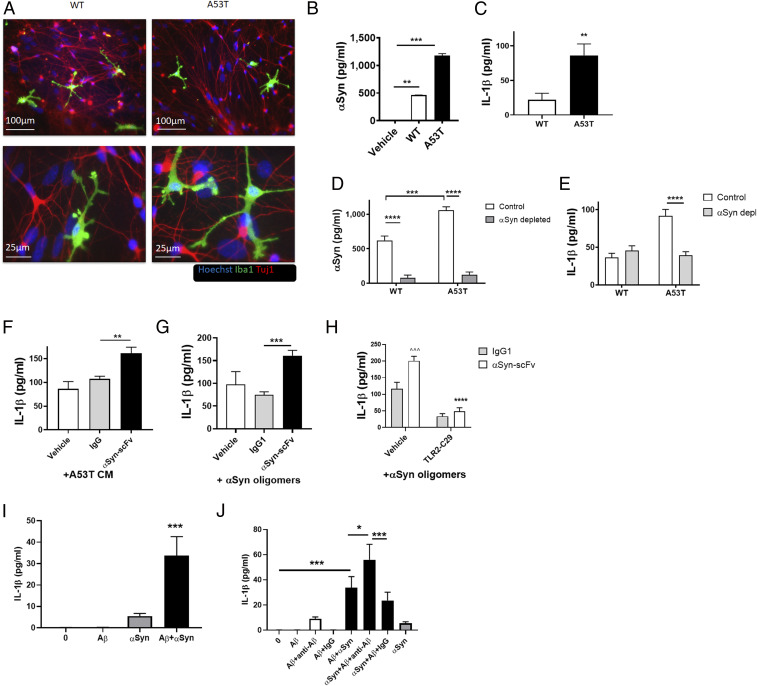
Fig. 3.
A53T αSyn mutant CM from hiPSC-derived DA neurons and Ab–αSyn complex activate the inflammasome in hiMG. (A) Representative images of astrocyte/DA neuron/microglia coculture of A53T and isogenic control (WT) neurons. Iba1 (green), Tuj1 (red), and Hoechst (blue). (A, Top) Low magnification. (Scale bars, 100 µm.) (A, Bottom) Higher magnification. (Scale bars, 25 µm.) (B) αSyn levels in CM from WT and A53T CM (n = 4). (C) IL-1β release from hiMG exposed to CM from WT and A53T DA neurons (n = 6 to 8). (D) Secreted αSyn levels in αSyn-immunodepleted CM from isogenic corrected (WT) and A53T DA neurons (n = 4 per group). (E) IL-1β release from hiMG exposed to αSyn-immunodepleted CM from isogenic corrected (WT) and A53T DA neurons (n = 7 to 11). (F) IL-1β release from hiMG exposed to CM from isogenic corrected (WT) and A53T DA neurons pretreated with humanized αSyn scFv or human IgG1 control. Note the increased effect of Ab on CM from A53T over isogenic corrected (WT), consistent with their increased production of αSyn oligomers (n = 6 to 8). (G) Quantification of IL-1β from hiMG exposed to oligomeric αSyn (750 nM) pretreated with humanized αSyn scFv or human IgG1 control (n = 5 to 10). (H) IL-1β secretion from hiMG exposed to oligomeric Aβ (10 µM) and low concentrations of oligomeric αSyn (100 nM) with anti-Aβ Ab, compared with IgG control. ^Comparison with vehicle-IgG. *Comparison with vehicle-scFv (n = 7 to 9). (I) IL-1β release from hiMG following TLR2 inhibition. (n = 7). (J) IL-1β release from hiMG exposed to oligomeric Aβ (10 µM), low concentrations of oligomeric αSyn (100 nM), or a combination, showing a synergistic effect (n = 7 per group). Graphs indicate mean ± SEM. Statistical analysis was performed using a two-way ANOVA with Bonferroni post hoc test (*P < 0.05, **P < 0.01, ^^^P or ***P < 0.001, ****P < 0.0001).

