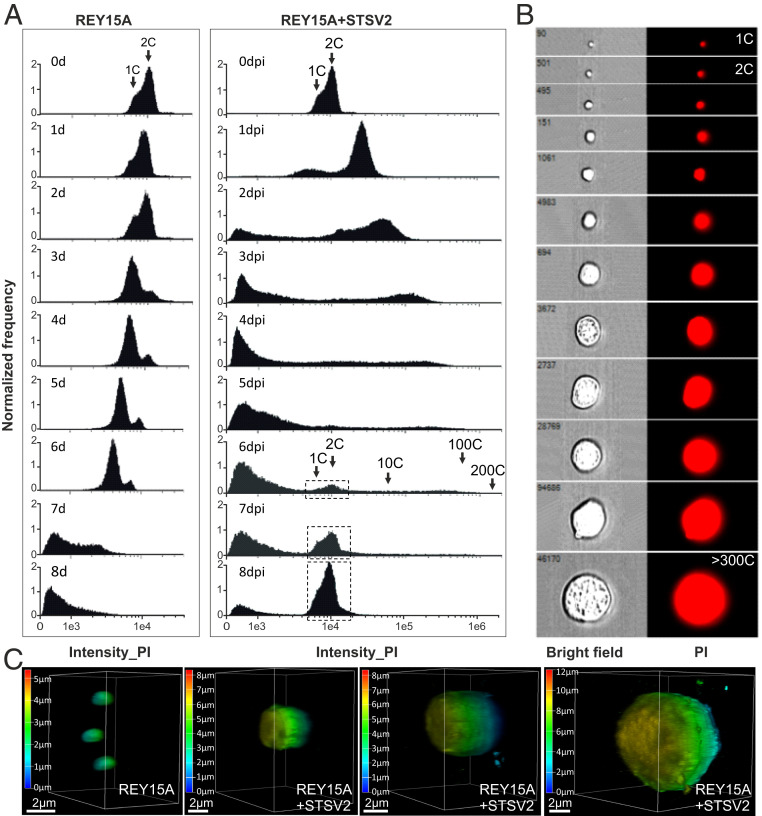
Fig. 2.
STSV2-infected giant cells contain increased DNA content. (A) Flow cytometry analysis of noninfected (Left) and STSV2-infected (Right) REY15A cells. Cell cultures were sampled and analyzed at the indicated time points. Arrows indicate cells with the DNA content corresponding to the equivalents of 1 copy (1C), 2C, 10C, 100C, and 200C of genomic DNA. The dotted boxes indicate the region of cells containing the DNA content corresponding to 1 and 2 copies, which reappeared in the infected cells at 6 dpi. (B) Representative images showing single cells sorted by flow cytometry with different diameters and DNA content equivalents ranging from 1 copy to more than 300 copies. PI, propidium iodide. (C) Three-dimensional reconstruction images of noninfected and STSV2-infected REY15A cells with different diameters. The cells were stained with DAPI and observed using a Leica SP8 confocal microscope. The images were analyzed by the Leica Application Suite X (LAS X) software and displayed in the volume mode. The color scale indicates the Z-depth. (Scale bars, 2 μm.)

