Fig. 5.
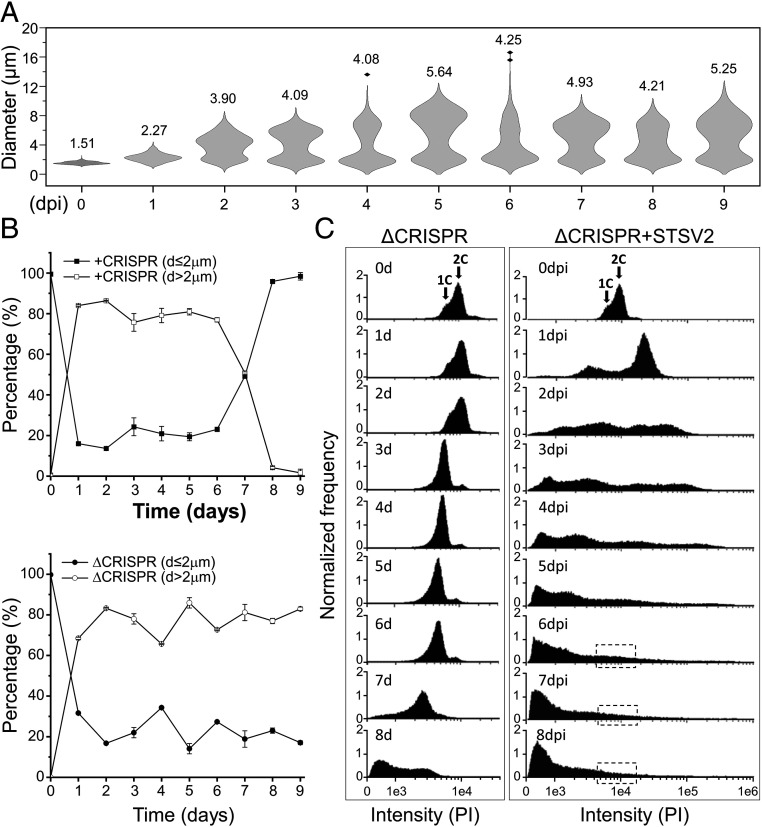
CRISPR-Cas system is indispensable for the emergence of a resistant population. (A) Size distribution of the STSV2-infected CRISPR-deficient ΔC1C2 cells during different time points after infection. The width of the distribution corresponds to the frequency of occurrence. The numbers above the plots represent median diameters of cells during each time point. Cell culture was sampled at the indicated time points and the diameters of 600 cells from two independent experiments were measured at each time point. (B) Changes in the diameter of cells with (Top) and without (Bottom) the CRISPR immune system during STSV2 infection. For convenience of presentation, cells were grouped into two categories—those with d ≤ 2 µm and those with d > 2 µm. (C) Flow cytometry analysis of the DNA content in the ΔCRISPR mutant during the infection with STSV2. Cell cultures were sampled and analyzed at the indicated time points. Arrows indicate cells with the DNA content corresponding to the equivalents of one and two copies (1C and 2C, respectively) of genomic DNA. The dotted boxes indicate the region corresponding to the DNA content of one and two copies, which reappeared in the CRISPR-containing cell culture (Fig. 2A).

