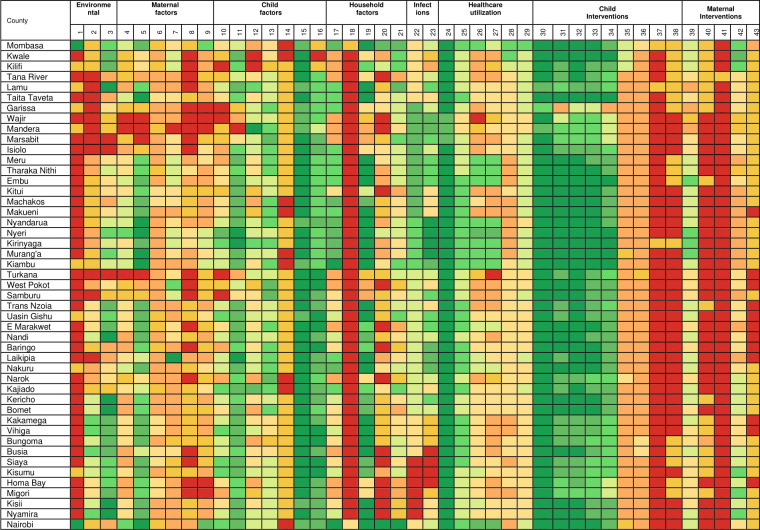
Figure 3.
Ranking of factors associated with child survival in 1993 from low intervention coverage or high disease prevalence (red) to high intervention coverage or low disease prevalence (green). The second row are the 43 factors (table 2) while online supplemental file 3 has the actual values. Colour codes can be compared within an indicator across the 47 spatial units in 1993 and 2014 but not between factors. Source: author. An octile ranking was used to divide each factor into eight equal classes from <12.5% to ≥87.5% for interventions whose coverage varied from 0% to 100%. For factors whose coverage was not expected to range between 0% and 100% (such as nutrition status), they were first rescaled to 0%–100% and then divided into octiles.

