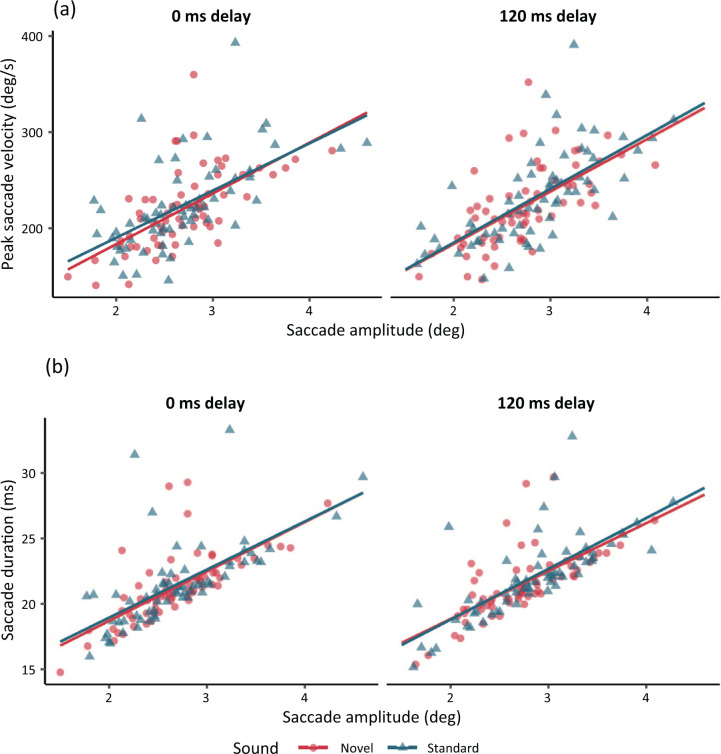
Figure 4.
A scatterplot of peak saccade velocity and saccade amplitude (a) and saccade duration and saccade amplitude (b) in the two onset delay conditions (“main sequence”; Bahill et al., 1975). Each data point shows the mean value for novel (circle shape) and standard sounds (triangle shape) for each subject. Lines show the regression slopes.

