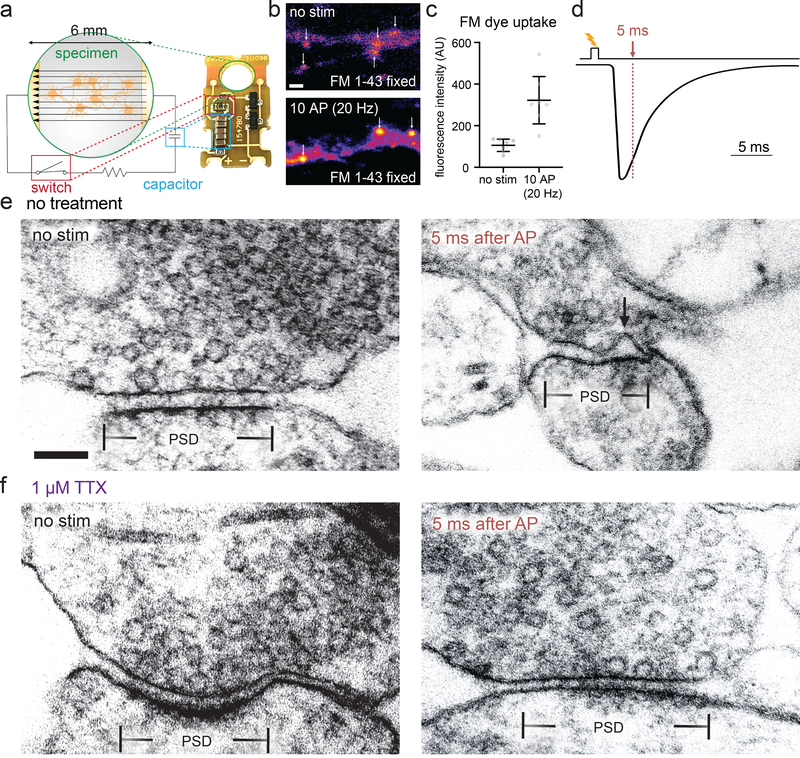
Figure 1. Zap-and-freeze captures synaptic vesicle fusion.
a, Schematic and photograph of the zap-and-freeze stimulation device. b, Epifluorescence micrographs of cultured mouse hippocampal neurons pre-incubated in 30 μM Pitstop 2 in physiological saline (1 mM Ca2+) for 2 min, then either not stimulated or subjected to 10× 1 ms pulses at 20 Hz, at 37 °C in FM 1–43FX, followed by washing and fixation. Arrows indicate putative presynaptic terminals, identified by their increased FM labeling relative to the rest of the axon, shape, and size. Scale bar: 2 μm. c, Quantification of the experiment described in b; n = 7 fields of view with 20 total putative boutons quantified per image; p = 0.003, two-sided Welch’s t-test. N = 1 experiment. Note that the images shown in b are crops of a small portion of the full field of view for each image. Error bars indicate mean and 95% confidence interval. d, Experimental design for stimulation and freezing, showing a diagrammatic excitatory postsynaptic current for reference (based on 28). A 1-ms square pulse is applied to trigger a single action potential, then neurons are frozen 5 ms after the beginning of the pulse (this is the earliest possible freezing time on the high-pressure freezer, see Methods). e-f, Transmission electron micrographs of synapses from neurons high-pressure frozen in 1.2 mM Ca2+ either e without or f with tetrodotoxin (TTX), which prevents action potential firing. Samples were frozen either with no stimulation (“no stim”) or 5 ms after stimulation, which presumably initiates an action potential (“5 ms after AP”). The arrow indicates a pit in the active zone, which is presumed to be a synaptic vesicle fusing with the plasma membrane. The active zone is defined as the presynaptic plasma membrane opposite the post-synaptic density (PSD). Scale bar: 100 nm. Electron micrographs are from experiments described in Figure 3 (from two experiments from separate cultures frozen on different days, except for the data from TTX treatment without stimulation, which are from a single experiment, and data from 5 and 8 ms, which are from three experiments). See Supplementary Table 1 for full pairwise comparisons and summary statistics.

