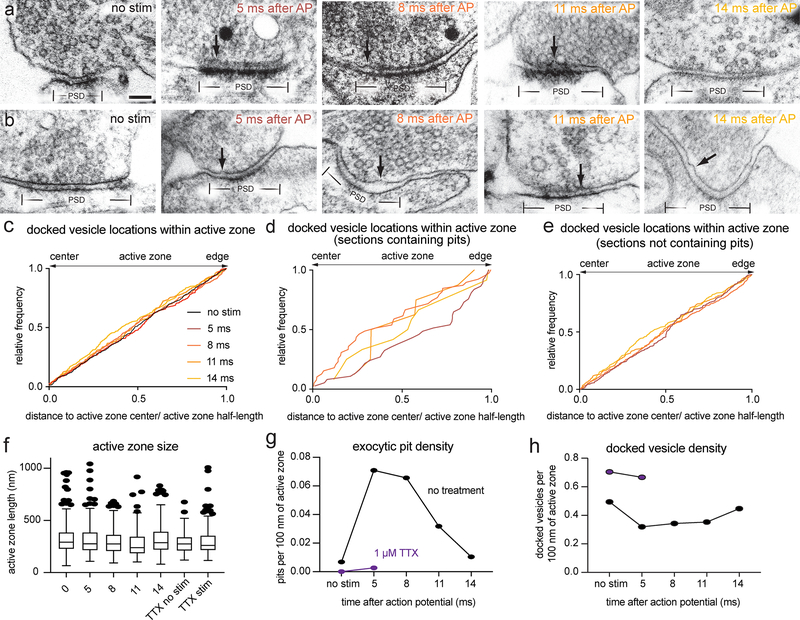
Extended Data Fig. 5. Fusion intermediates at multiple time points during the first 14 ms after an action potential.
a-b, Example transmission electron micrographs of synapses from neurons frozen without stimulation or 5, 8, 11, or 14 ms after an action potential (these are other examples from the same experiments shown in Figure 3). c, Cumulative relative frequency of locations of docked vesicles within the active zone, normalized to the size of the active zone (no stim, n = 447; 5 ms, n = 300; 8 ms, n = 348; 11 ms, n = 188; 14 ms, n = 306 docked vesicles). d, Same data as in c, showing only vesicles from synaptic profiles that contain pits. e, Same data as in c, showing only vesicles from synaptic profiles that contain do not contain pits. f, Size of active zones from data in Figure 3. Tukey boxplot shown; center: median, lower bound of box: 25th percentile, upper bound of box: 75th percentile, lower whisker: 25th percentile minus 1.5x interquartile range, upper whisker: 75th percentile plus 1.5x interquartile range; dots indicate values outside this range. No stim, n = 274; 5 ms, n = 315; 8 ms, n = 343; 11 ms, n = 192; 14 ms, n = 211; TTX, no stim, n = 121; and TTX, 5 ms, n = 255 synaptic profiles. g, Density of pits in the active zone, from the experiments shown in Figure 3. Calculated as the total number of pits from a given sample x100, divided by the sum of the total length of active zones from that sample. h, Density of docked vesicles in the active zone, from the experiments shown in Figure 3. Calculated as the total number of docked vesicles from a given sample x100, divided by the sum of the total length of active zones from that sample. Scale bar: 100 nm. PSD: post-synaptic density. AP: action potential. Arrows indicate “pits” in the active zone (opposite the post-synaptic density), which are presumed to be vesicles fusing with the plasma membrane. All data are from two experiments from separate cultures frozen on different days, except for the data from TTX treatment without stimulation, which are from a single experiment, and data from 5 and 8 ms, which are from three experiments. See Supplementary Table 1 for full pairwise comparisons and summary statistics.

