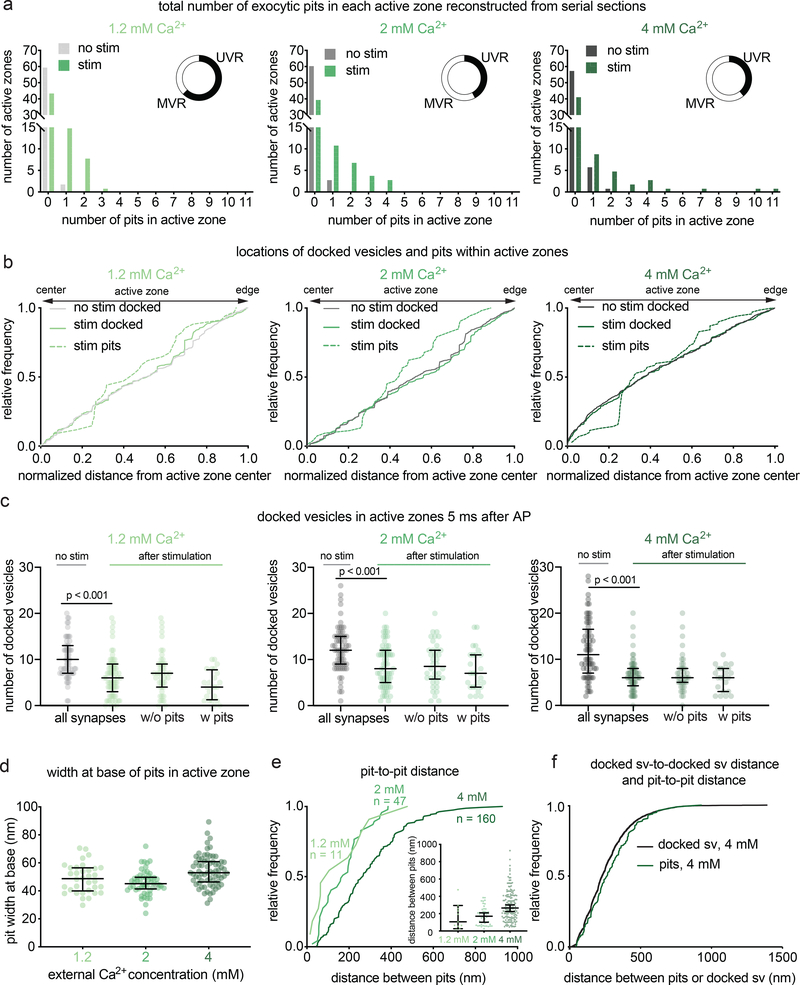
Figure 2. Multiple fusion events at single active zones after a single action potential.
a, Frequency distributions of number of fusion events 5 ms after an action potential (green) or without stimulation (grey) in solutions of 1.2, 2, or 4 mM Ca2+ (1.2 mM, no stim, n = 62; 1.2 mM, stim, n = 68; 2 mM, no stim, n = 64; 2 mM, stim, n = 66; 4 mM, no stim, n = 65; 4 mM, stim, n = 64 reconstructed active zones). Insets show the proportion, out of the active zones that contained at least 1 fusion event, that contained 1 fusion event (UVR, univesicular release) or more than 1 fusion event (MVR, multivesicular release). Fusion events are defined as “pits” in the active zone. Including all active zones from stimulated samples, number of pits was not significantly different in different Ca2+ concentrations (p = 0.88); including only synapses with at least 1 fusion event, the number of pits was significantly greater at 4 mM than at 1.2 mM (p = 0.042). The proportion of synapses that contained at least 1 pit was not different between samples stimulated in different Ca2+ concentrations (chi-square = 0.2771, df = 2, p = 0.87). b, Cumulative relative frequency distributions of locations of docked vesicles (with and without stimulation) and pits (after stimulation) within the active zone (n = 34, 54, 70 pits; 384, 768, 778 docked vesicles without stimulation; 384, 579, 423 docked vesicles with stimulation, ordered by increasing Ca2+ concentration). Locations are normalized to the size of the active zone and to the expected density of objects within a circular area by taking the square of the distance of a pit or vesicle to the center of the active zone divided by the half-length of the active zone: 0.25 would indicate a vesicle or pit halfway between the center and edge. Docked vesicles were not biased toward the center or edge except for samples frozen in 4 mM Ca2+, which were biased toward the center, and samples frozen after stimulation in 2 mM Ca2+, which was biased toward the edge (1.2 mM no stim, p = 0.26; 1.2 mM stim, p = 0.14; 2 mM no stim, p = 0.142; 2 mM no stim, 2 mM Ca2+ stim, p =0.02; 4 mM Ca2+ no stim, p < 0.001; 4 mM stim, p < 0.001). Vesicles fusions not biased toward the center or the edge (p > 0.9 for 1.2 mM 2 mM, p = 0.05 for 4 mM). For each calcium concentration, the median location of pits and docked vesicles in the active zone after stimulation were similar to those of docked vesicles from no-stim controls (p > 0.9 for each). c, number of docked vesicles in each active zone reconstruction 5 ms after an action potential (green) or without stimulation (grey); same n as in a. The number of docked vesicles was not significantly different between synapses with and without pits for each calcium concentration (p > 0.1 for each comparison; Kruskal-Wallis test with post-hoc Dunn’s multiple comparisons). Vesicles that appeared to be in contact with the plasma membrane were considered docked. Error bars indicate median and interquartile range. d, Width at base of pits in the active zone. Error bars indicate median and interquartile range. n = 34, 54, 70 pits, ordered by increasing Ca2+ concentration. e, Cumulative relative frequency distributions of distances from center to center of pits within the same active zone, sorted by external calcium concentration. Inset: same data, shown as dot plots. Although the median distance increases with increasing calcium, the most tightly coupled pits are still present. Error bars indicate median and interquartile range. f, Cumulative relative frequency distributions of distances from center to center of pits and docked vesicles within the same active zone (n = 218 pairs of pits, 5438 pairs of docked vesicles; see Methods for description of distance calculation). Pit-to-pit distances were slightly greater than docked vesicle-to-docked vesicle distances (pits median: 224 nm, docked median: 265 nm; p = 0.02). Pairs of pits were from stimulated samples in 4 mM Ca2+; pairs of docked vesicles were from the no-stim 4 mM Ca2+ experiment. Scale bar: 100 nm. PSD: post-synaptic density. AP: action potential. Error bars in c indicate median and interquartile range. All data are from two experiments from separate cultures frozen on different days.; experiments in 1.2 mM Ca2+ were performed on separate days from a separate culture from the experiments in 2 mM and 4 mM Ca2+. Number of pits and docked vesicles per active zone (a-b) was compared using Kruskal-Wallis tests with post-hoc Dunn’s multiple comparisons test. For pits, full pairwise comparisons were performed; for docked vesicles, only numbers of vesicles before and after stimulation at each Ca2+ concentration were compared. Proportions of active zone reconstructions that contain at least one pit were compared using a chi-squared test. Bias of pit locations toward the center or edge of the active zone was tested by comparing each group to a theoretical median of 0.5, the expected median for a random distribution, using two-tailed one-sample Wilcoxon signed-rank tests. Locations of pits, docked vesicles after stimulation, and docked vesicles without stimulation were compared using a Kruskal-Wallis test followed by post-hoc Dunn’s test between pits and no-stim docked vesicles and stim docked vesicles and no-stim docked vesicles for each calcium concentration. P-values from all these pairwise and one-sample comparisons were adjusted with Bonferroni correction accounting for the total number of tests. The distances between pits in different calcium concentrations were compared using a Kruskal-Wallis test followed by post-hoc Dunn’s test. The distributions of distances between pits in the same active zone and docked vesicles within the same active zone were compared using a two-sided Wilcoxon rank-sum test. See Supplementary Table 1 for full pairwise comparisons and summary statistics. See Supplementary Table 2 for summary statistics of docked vesicle and pit counts for each experimental replicate.

