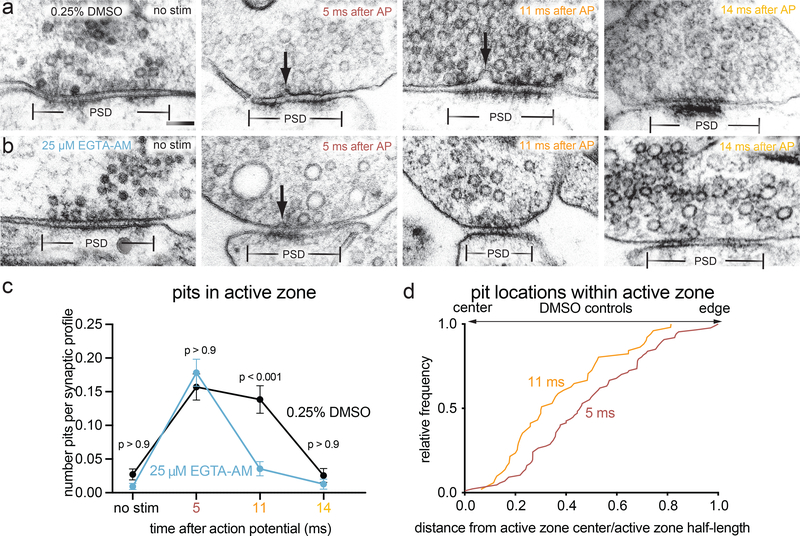
Figure 4. Fusions captured at 5 and 11 ms after an action potential represent synchronous and asynchronous release.
a-b, Example transmission electron micrographs of synapses from neurons pre-treated with a 0.25% DMSO or b 25 μM EGTA-AM and frozen either without stimulation, 5 ms after stimulation, 11 ms after stimulation, or 14 ms after stimulation. Arrows indicate pits in the active zone, which are presumed to be synaptic vesicles fusing with the plasma membrane. c, Number of pits in the active zone per synaptic profile (part of the synapse captured in a 2-D section) in the above conditions. p-values are from comparisons between EGTA- (no stim, n = 430; 5 ms, n = 421; 11 ms, n = 365; 14 ms, n = 236 synaptic profiles) and DMSO-treated (no stim, n = 405; 5 ms, n = 465; 11 ms, n = 318; 14 ms, n = 235 synaptic profiles) samples frozen at the same time point. Numbers of pits at 11 ms and without stimulation in EGTA-AM-treated samples were not significantly different (p > 0.9). d, Locations of pits within the active zone 5 ms (n = 87 pits) and 11 ms (n = 51 pits) after stimulation from neurons pre-treated with 0.25% DMSO. Pits at 11 ms were significantly biased toward the center of the active zone (p < 0.001), while those at 5 ms were not biased toward the center or the edge (p > 0.9). Scale bar: 100 nm. PSD: post-synaptic density. AP: action potential. Error bars in c indicate standard error of the mean. All data from the experiments described in Figure 4 are from 4 experiments for no stim and 5 ms time points, 3 experiments for 11 ms, and 2 experiments for 14 ms, from separate cultures frozen on different days (See Supplementary Table 2 for count data from each experiment).Numbers of pits in c were compared using a Kruskal-Wallis test with full pairwise comparisons by post-hoc Dunn’s multiple comparisons test (only comparisons between the same time point with and without EGTA-AM are shown). Locations of pits in d were compared using a two-sided Wilcoxon rank-sum test. Bias of pit locations toward the center or edge of the active zone was tested by comparing each group to a theoretical median of 0.5 using one-sample two-tailed Wilcoxon signed-rank tests; Bonferroni correction was applied to all p-values from two-sample and one-sample tests to account for these extra comparisons. See Supplementary Table 1 for full pairwise comparisons summary statistics. See Supplementary Table 2 for summary statistics of pit counts for each experimental replicate.

