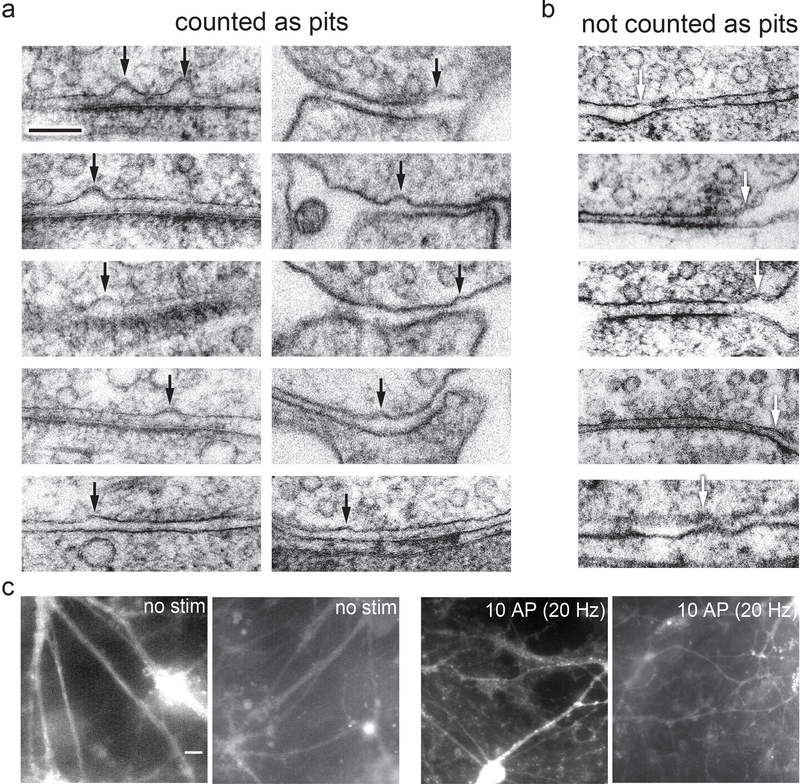
Extended Data Fig. 2. Examples of pits in the active zone compared to pits outside the active zone or features not quantified as pits.
a, Examples of pits in the active zone 5 ms after stimulation, indicated by black arrows. b, Examples of features not counted as pits, for instance because the curvature in the presynaptic membrane is mirrored by the postsynaptic membrane, indicated by white arrows. Scale bar: 100 nm c, Full fields-of-view of micrographs from the FM dye experiment described in Figure 4b. Images from experiments described throughout the manuscript (N = 10 freezes from separate cultures on separate days). Cultured mouse hippocampal neurons were pre-incubated in 30 μM Pitstop 2 in physiological saline (1 mM Ca2+) for 2 min, then either not stimulated or subjected to 10× 1 ms pulses at 20 Hz, at 37 °C in FM 1–43FX, followed by washing and fixation. Note that puncta along the processes became apparent after, suggesting that the zap-and-freeze device induces synaptic vesicle fusion and endocytosis. These images were collected randomly throughout the sapphire disks. Scale bar: 20 microns N = 1 experiment.

