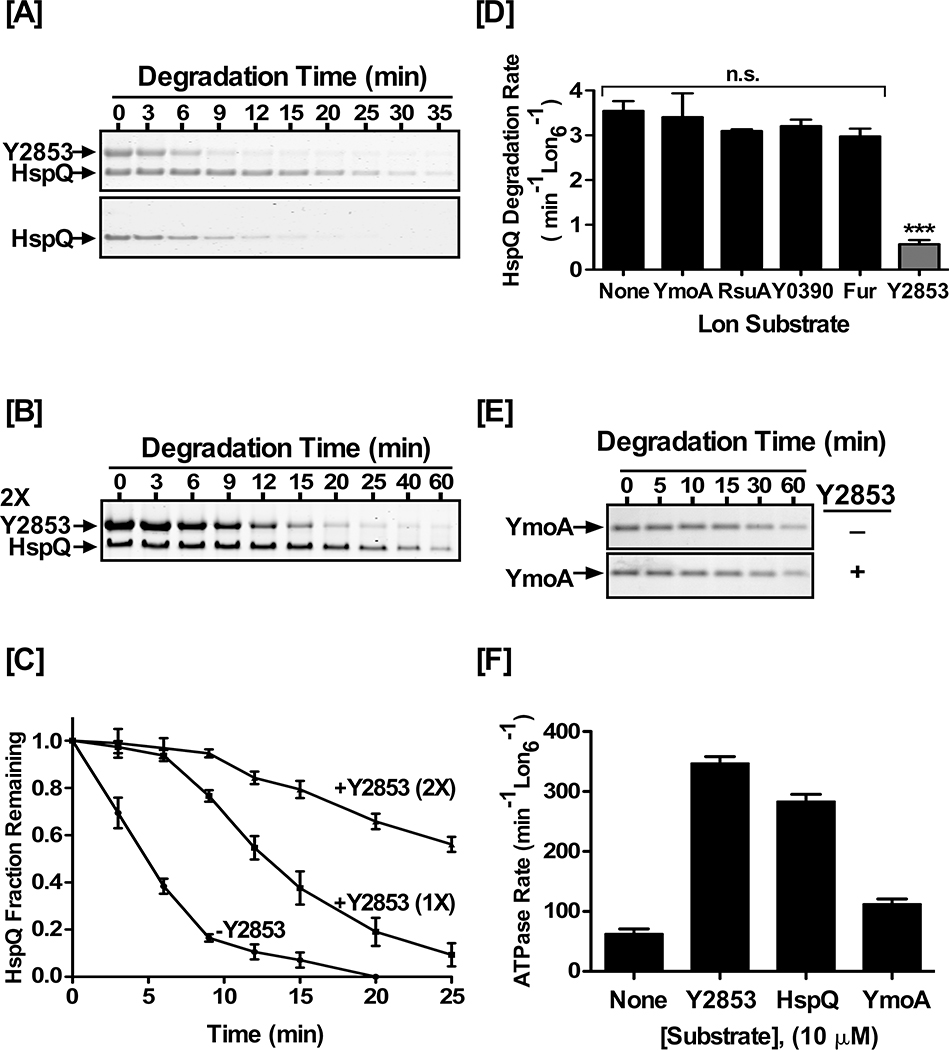
Figure 4: Y2853 and HspQ have partially overlapping binding sites.
(A) Y2853 delays HspQ degradation by Lon. In vitro Lon proteolysis of 10 μM HspQ was carried out in absence or presence of (A) equimolar and (B) two molar equivalent (2X) concentration of Y2853. Reactions were carried out in Lon activity buffer and 200 nM Lon6 at 37°C. (C) HspQ fraction remaining from proteolysis reactions in (A) and (B) are plotted over time. Data are normalized to protein amount at the zero time point for each degradation assay. (D) Degradation rate of HspQ in absence and presence of 10 μM concentration of the indicated protein substrates. One-tailed t-test between no substrate addition and specified substrate was performed to calculate the p-values as n.s. p= 0.3851 (YmoA), n.s. p= 0.1158 (RsuA), n.s. p= 0.1328 (Y0390), n.s. p=0.0551 (Fur), *** p<0.0001 (Y2853). (E) In vitro Lon proteolysis of YmoA in absence and presence of 10 μM Y2853. Reactions were carried out as described above. (F) Substrates stimulated ATP hydrolysis by Lon. ATP hydrolysis rates were determined in the presence of 10 μM concentration of each substrate. Representative Coomassie Brilliant Blue stained gels are shown, and the data presented in graphs are from three independent experiments (mean ± SEM).

