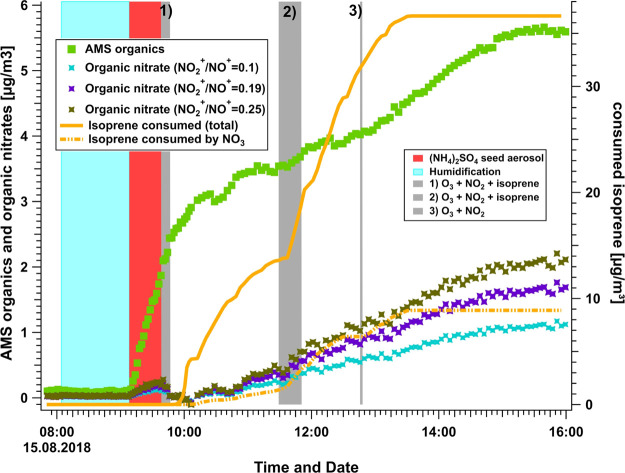
Figure 4.
Time-series data for 15 August experiment, showing the AMS organics and calculated organic nitrates using different NO2+/NO+ ion ratios on the left axis. The calculated isoprene consumed by NO3 and total consumed isoprene are shown on the right axis. Colored bars indicate the start and duration of additions to the chamber such as water, seed aerosols, NO2, O3, and isoprene.

