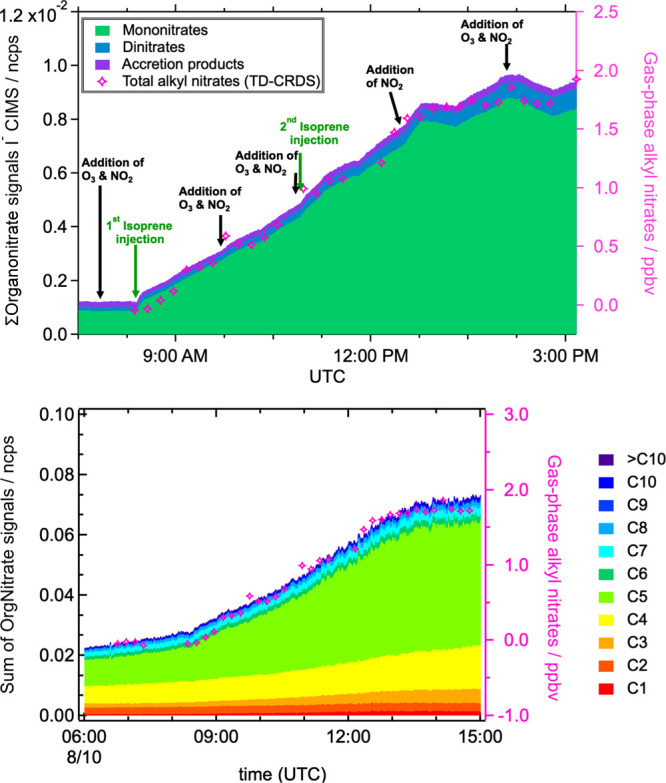
Figure 7.

Upper panel: time series of classes of summed organonitrates measured by I– CIMS (normalized counts per second), compared to total AN time series. Lower panel: time series of organic nitrate signals of various carbon numbers measured by Br– CIMS (normalized counts per second), compared to total AN time series. All data are uncorrected for wall losses. These comparisons show some later formation of dinitrates that may be responsible for the larger than 100% AN yield.
