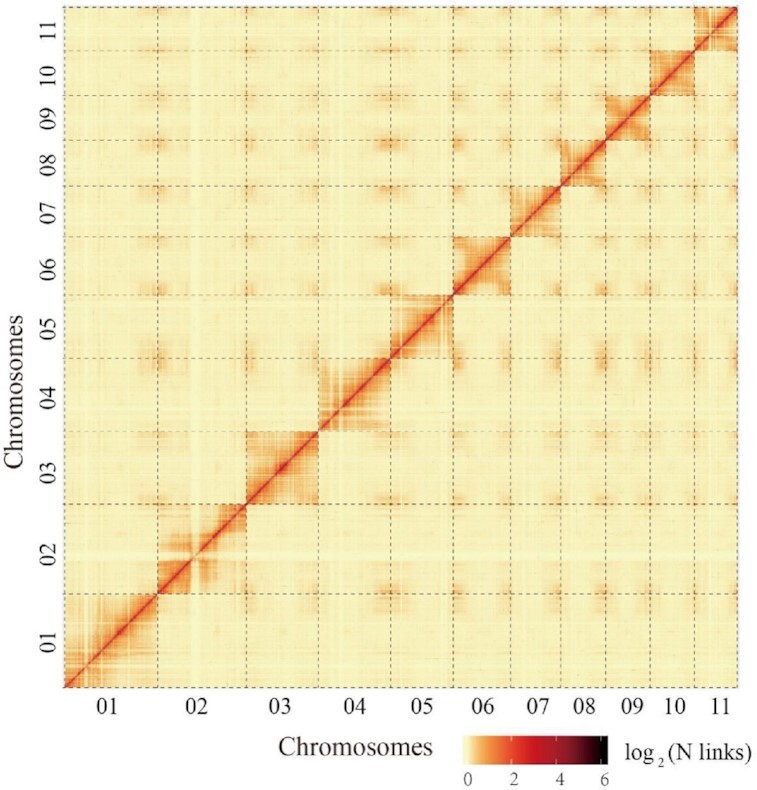
Figure 2:

Interaction frequency distribution of Hi-C links among 11 chromosomes. Genome-wide Hi-C map of C. heterophylla. We scanned the genome by 500-kb nonoverlapping window as a bin and calculated valid interaction links of Hi-C data between any pair of bins. The log2 of link number was transformed. The color key of heat map ranging from light yellow to dark red represents the frequency of Hi-C interaction links from low to high (0–6).
