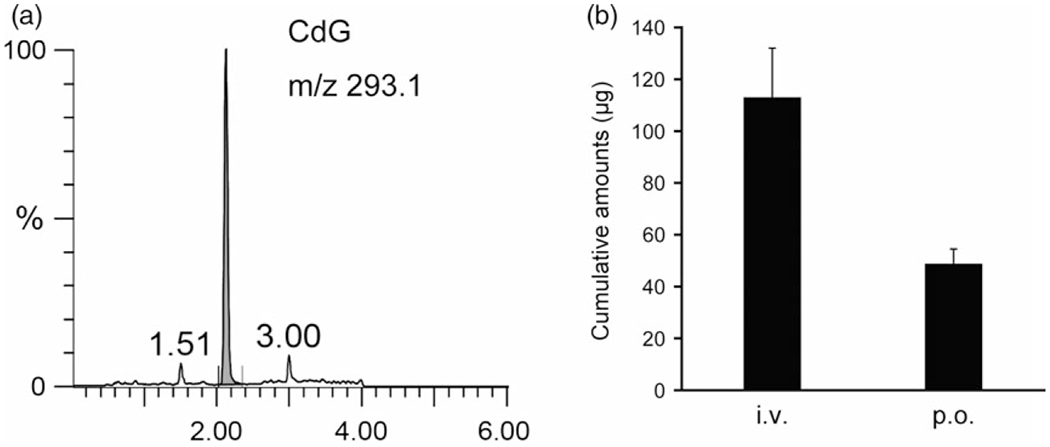
Figure 5.

(a) LC/MS chromatograms of CdG in urine. Urine samples were pretreated with the SPE column (Waters Oasis® MCX 96-well plate) for extracting CdG as described in the Materials and Methods section. (b) Accumulative amount of CdG excretion in urine until 9 h after intravenous injection and oral administration at a dose of 1 mg/kg in rats. Urine samples were collected in a metabolic cage. The CdG concentrations in urine were measured using LC/MS with SPE method. The values are mean ± SD (n = 4).
