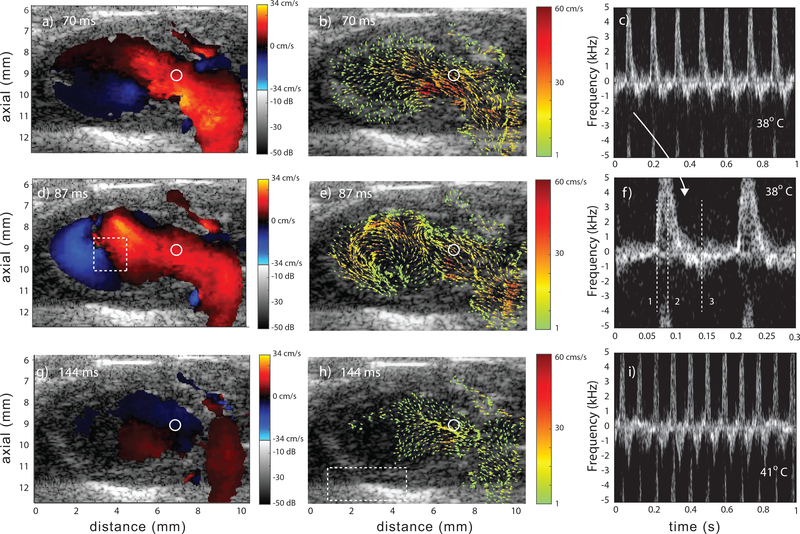
Fig. 4.
Representative data from a Fhf2WT/Y mouse at 38°C and three points in cardiac cycle: early diastole (a,b), mid diastole (d,e) and mid systole (g,h). Color Doppler (a,d,g), corresponding vector flow (b,e,h) and spectrograms at 38°C (c and f) and 41°C (i). The spectrogram in f) represents the region of flow marked with the circle in the color-Doppler and vector-flow images. A subregion spanning two cardiac cycles is shown in c) and has the three time points marked with vertical, numbered lines. The spectrogram in (i) represents the same ROI but at 41°C. The rectangular region in (d) represents the ROI for vorticity flow calculations and the region in (h) represents the ROI for the pericardium motion tracking (Sec. III–E). The regions of no flow were a result of the velocities being below the high-pass slow-time cutoff. Videos Mm02.mp4 and Mm03.mp4 show data at 38°C and 41°C, respectively.

