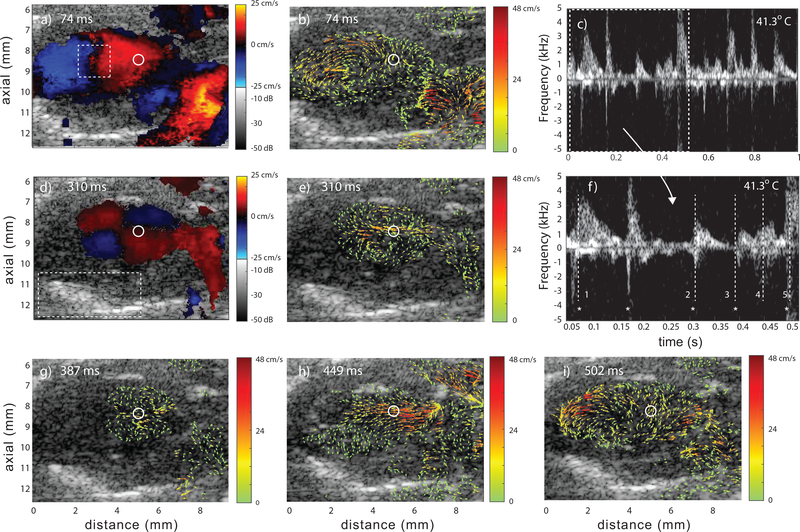
Fig. 5.
Representative data from a Fhf2KO/Y mouse at 41.3°C at five time points. Color Doppler (a,d), vector flow (b,e,g,h,i) and spectrograms (c and f) where f) is a subregion of c). The spectrograms represent the region of flow marked with the circle in the color-Doppler and vector-flow images. The five time points are marked in f) with vertical, numbered lines; (1,2,3,5) mid-to-late diastole and (4) systole. The * symbol represents a common reference point each cardiac cycle. The rectangular region in (a) represents the ROI for vorticity flow calculations and the region in (d) represents the ROI for the pericardium motion tracking (Sec. III–E). Video Mm04.mp4 shows 1 sec of data.

