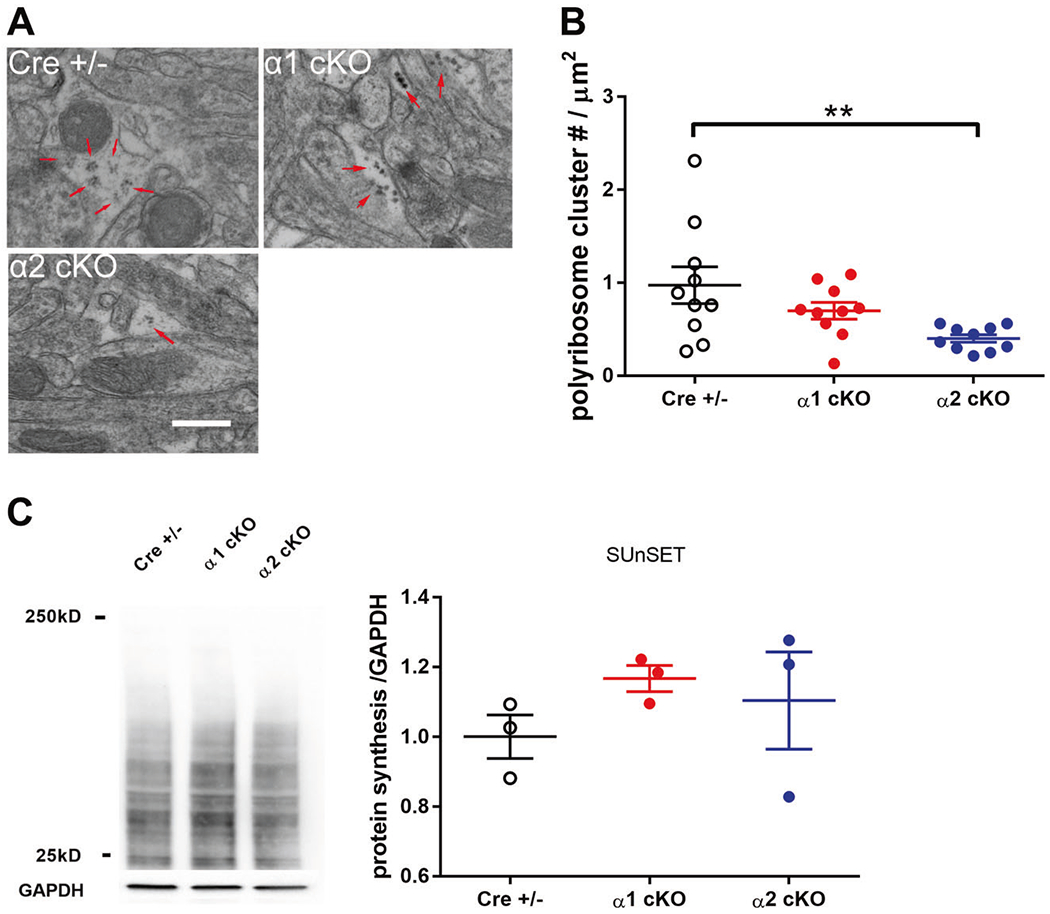
Fig. 5. Isoform-specific regulation of protein synthesis in AMPKα cKO mice.

a Representative EM images of hippocampal CA1 area of AMPKα1/α2 cKO and CRE+/− mice. Polyribosomes were indicated with arrows. Scale bar: 500 nm. b Cumulative data showing that the overall polyribosome cluster number per μm2 dendritic area was lower in AMPKα2 cKO mice than CRE+/− mice. n = 3 mice; **p <0.01, one-way ANOVA followed by Tukey’s post hoc test. c Representative images and quantification from the SUnSET de novo protein synthesis assay. n = 3 mice. One-way ANOVA.
