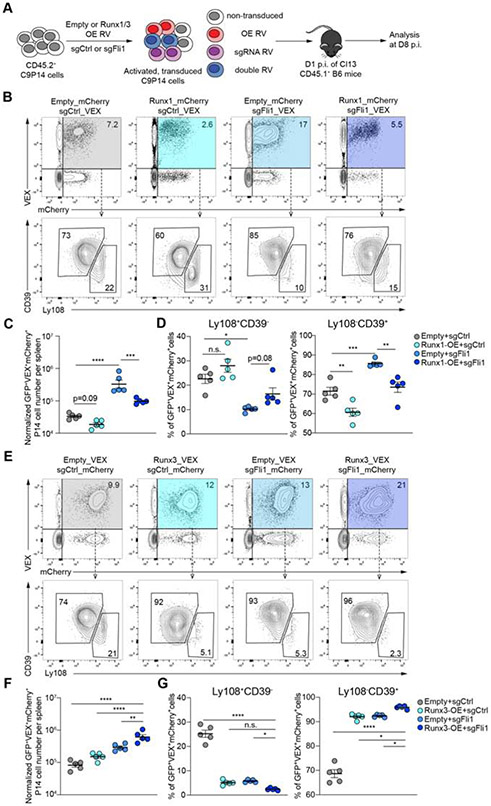
Figure 5. Overexpression of Runx1 or Runx3 in the context of Fli1-deficiency in CD8+ T cells.
A. Experimental design. On D0, CD8+ T cells were isolated from CD45.2+ C9P14 donor mice and activated; CD45.1+ WT recipient mice were infected with Cl13. On D1 p.i., activated C9P14 cells were transduced with sgRNA-RV or OE-RV and 1 x 10⁵ transduced cells adoptively transferred into infected recipient mice.
B-D. Flow cytometry plots (B) and statistical analysis (C-D) of VEX+mCherry+ C9P14 cells and Ly108−CD39+/Ly108+CD39− C9P14 cells from spleen for sgCtrl-VEX + Empty-mCherry, sgCtrl-VEX + Runx1-mCherry, sgFli1_290-VEX + Empty-mCherry and sgFli1_290-VEX + Runx1-mCherry on D8 p.i. of Cl13. Gated on Cas9(GFP)+CD45.2+ P14 cells.
E-G. Flow cytometry plots (E) and statistical analysis (F-G) of VEX+mCherry+ C9P14 cells and Ly108−CD39+/Ly108+CD39− C9P14 cells from spleen for sgCtrl-mCherry + Empty-VEX, sgCtrl-mCherry + Runx3-VEX, sgFli1_290-mCherry + Empty-VEX and sgFli1_290-mCherry + Runx3-VEX at D8 p.i. of Cl13. Gated on Cas9+CD45.2+ P14 cells.
*P<0.05, **P<0.01, ***P<0.001, ****P<0.001 versus control (One-Way Anova analysis). Data are representative of 2 independent experiments (mean±s.e.m.) with at least 5 mice/group.

