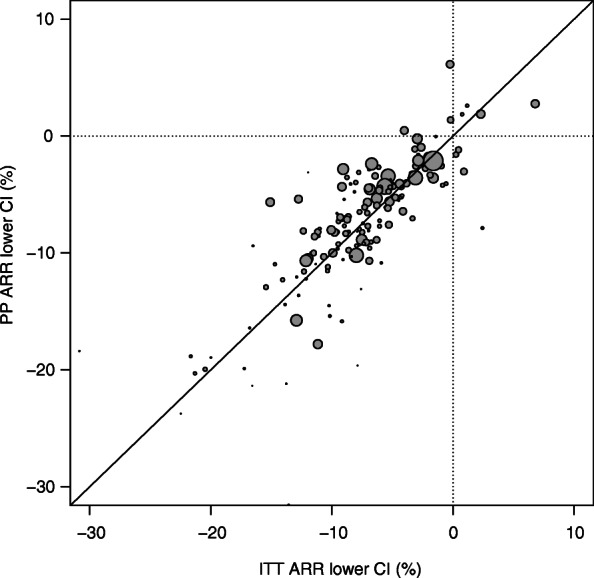
Fig. 4.

Graphical comparison of ITT versus PP lower CI limit. ARR = absolute risk reduction; CI = confidence interval; ITT = intention-to-treat; PP = per protocol. The size of the points on the graph is proportional to the sample size of the ITT population. A diagonal line is drawn at y = x, so ITT analysis is more conservative for points above the line and PP analysis is more conservative for points below the line. Three outliers were not included in this graph: 1) ITT lower CI of − 51.3% and PP lower CI of − 32.5%. 2) ITT lower CI of − 30.8% and PP lower CI of − 18.4%. 3) ITT lower CI of 15.7% and PP lower CI of 15.4%
