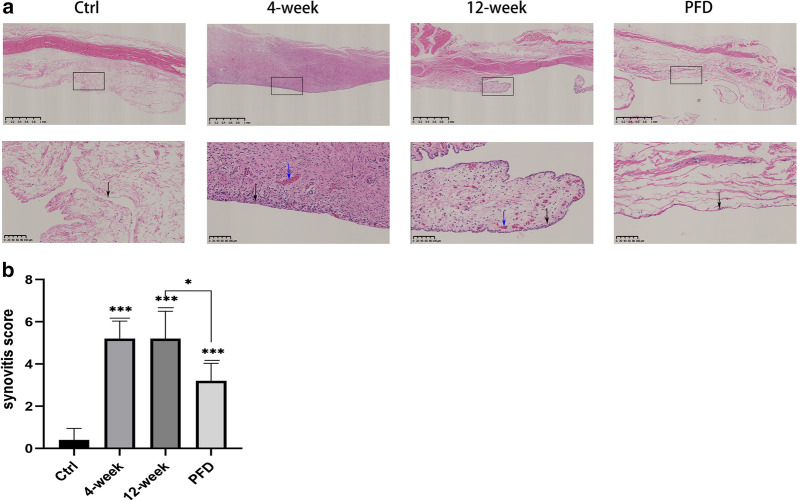
Fig. 5.
PFD reduced inflammation of the synovium. H&E staining of the synovium in different groups (a: scale bar of top row-1 mm; scale bar of bottom row-100 μm) and the corresponding synovitis scores (b). Black arrows indicate the lining of the synovium. In the control group, the lining was just 1–2 cells thick without hypertrophy or hyperplasia. Synoviocyte hypertrophy and hyperplasia were observed in the 4 and 12-week groups. Blue arrows indicate vascular proliferation, only observed in the 4 and 12-week groups. Data represent means ± SD. *P < 0.05, **P < 0.01, ***P < 0.001 (the 4 and 12-week groups were compared with the control group; the PFD group was compared with the sham and 12-week groups) (independent-samples t-test)

