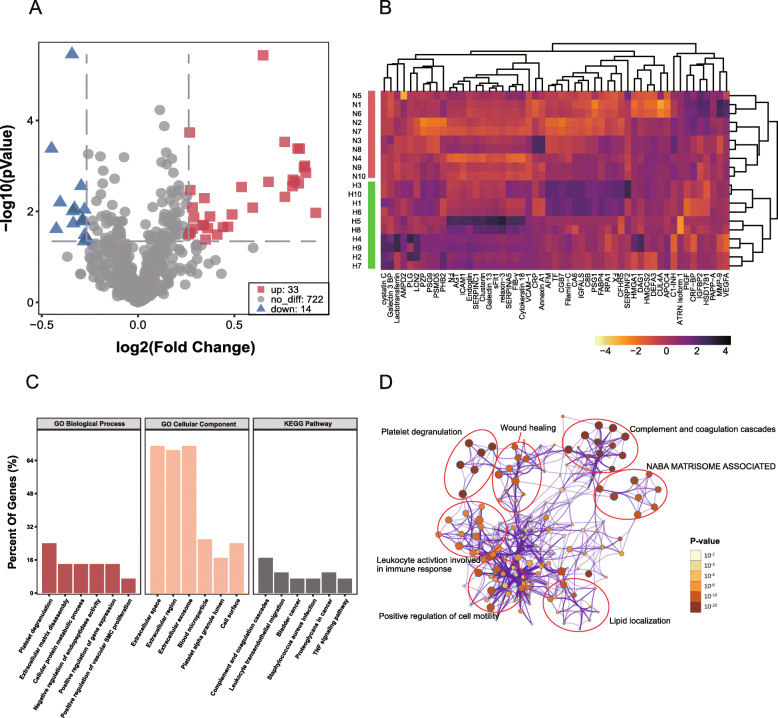
Fig. 1.
Protein profiles differ significantly between pre-HDP and normal pregnancies (n = 12). a, A volcano plot was used to analyse differentially expressed proteins. Red nodes represent upregulated proteins, and blue nodes represent downregulated proteins. Fold change> 1.2 and P-value< 0.05. b, Log2-transformed relative protein expression heatmap of all proteins profiled in the screening set. Green indicates HDP patients, and purple indicates healthy controls. Pearson correlation was used for clustering of proteins and Spearman’s correlation was used for samples. c, GO and KEGG enrichment of proteins included in the screening set (n = 47). Bands represent the top 6 enriched component terms. d, Pathway cluster analysis in Metascape software. Node size represents the number of pathway-enriched genes, and shade of colour represents the size of the adjusted P-value

