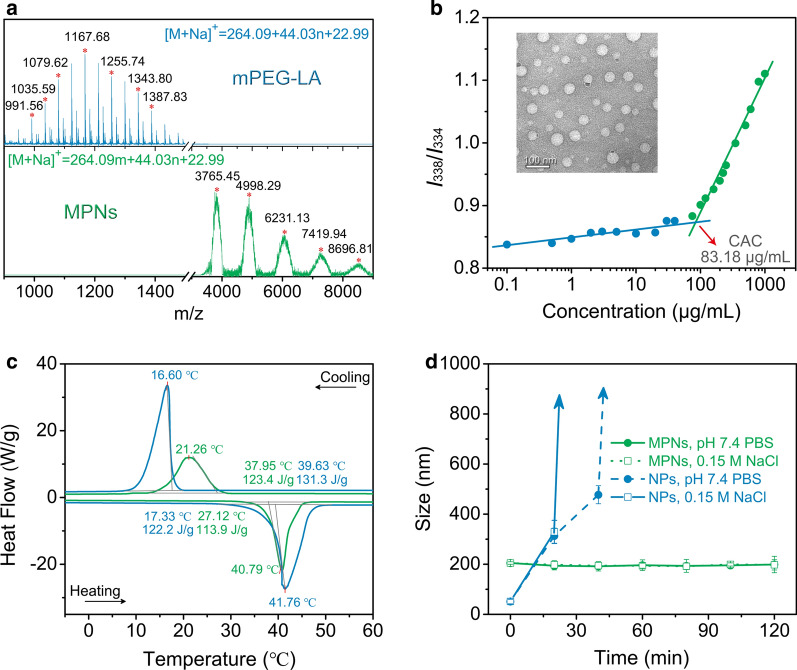
Fig. 1.
Characterization of NPs and MPNs. a MALDI-TOF mass spectra of mPEG-LA (blue) and MPNs (green). b Relationship between the fluorescence intensity ratio (I338/I334) and the mPEG-LA concentration in an aqueous solution at 25 ℃, [pyrene] = 6.7 × 10⁻⁷ M. Insert: transmission electron microscope (TEM) image of NPs. Scale bar: 100 nm. c DSC heating and cooling curves (10 ℃ min−1) for mPEG-LA (blue curve) and MPNs (green curve) from – 5 to 60 ℃ in nitrogen atmosphere. d Time-dependent size variation of NPs and MPNs at a physiological pH and a salt concentration at 25 ℃ (n = 3)

